KBR, Inc.'s management explains the business in its own materials. The slides below do the most of that work, pulled from the documents preserved in Sources. Each source link opens the complete presentation at that slide in a new tab.
KBR's own company overview: what it does, its two segments, unit economics and strategy in one deck. Predates the 2026 spin-off. · Open the full document →
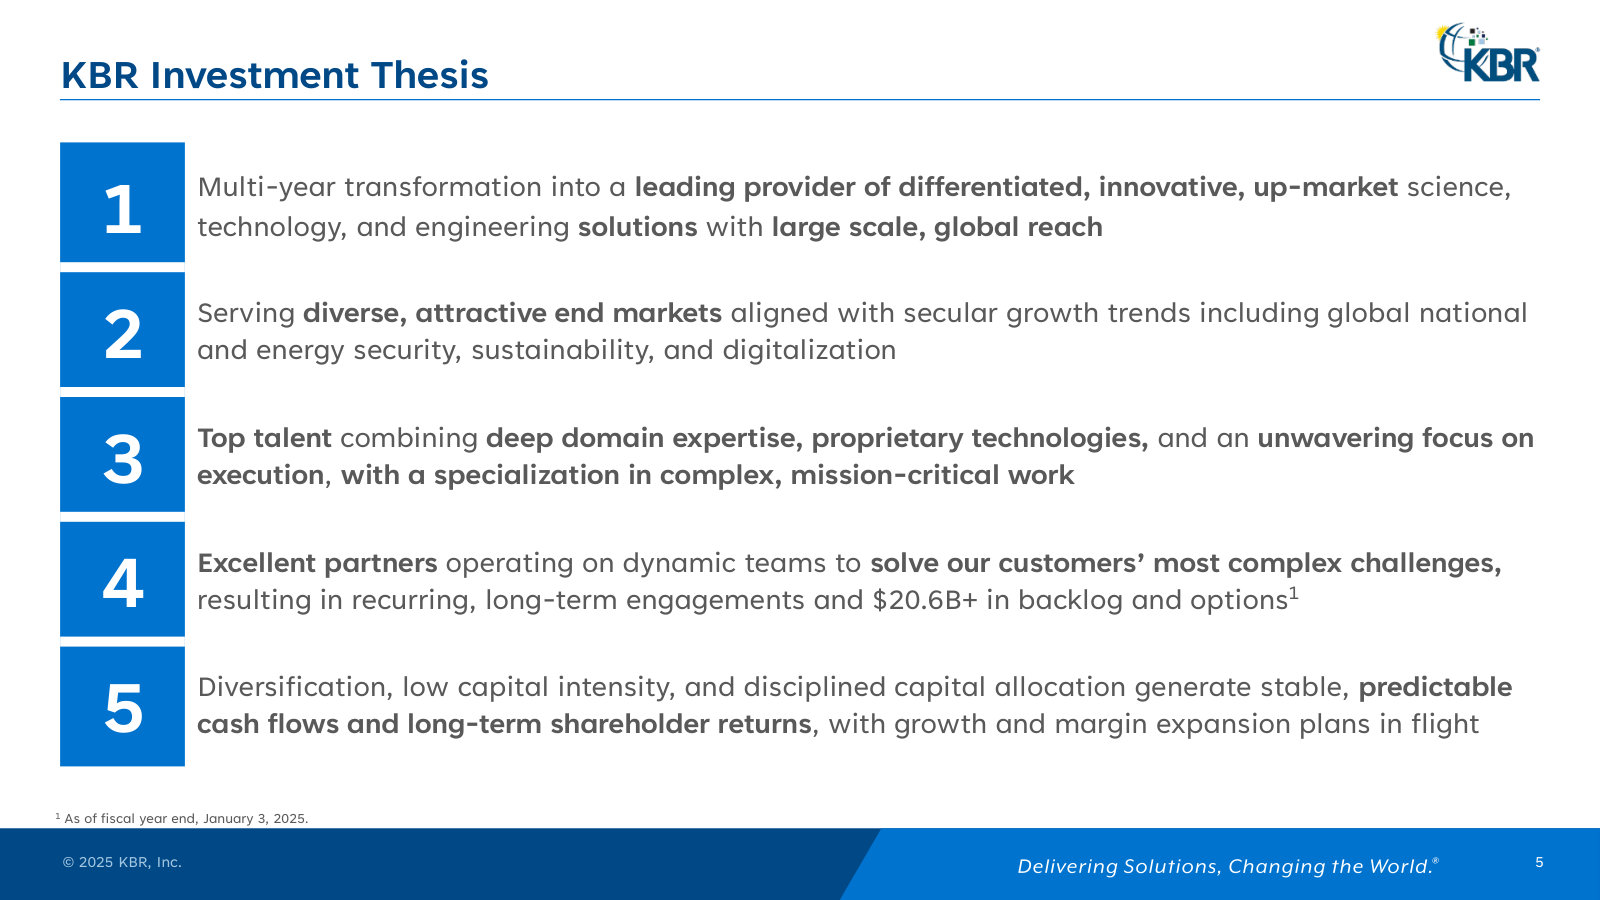
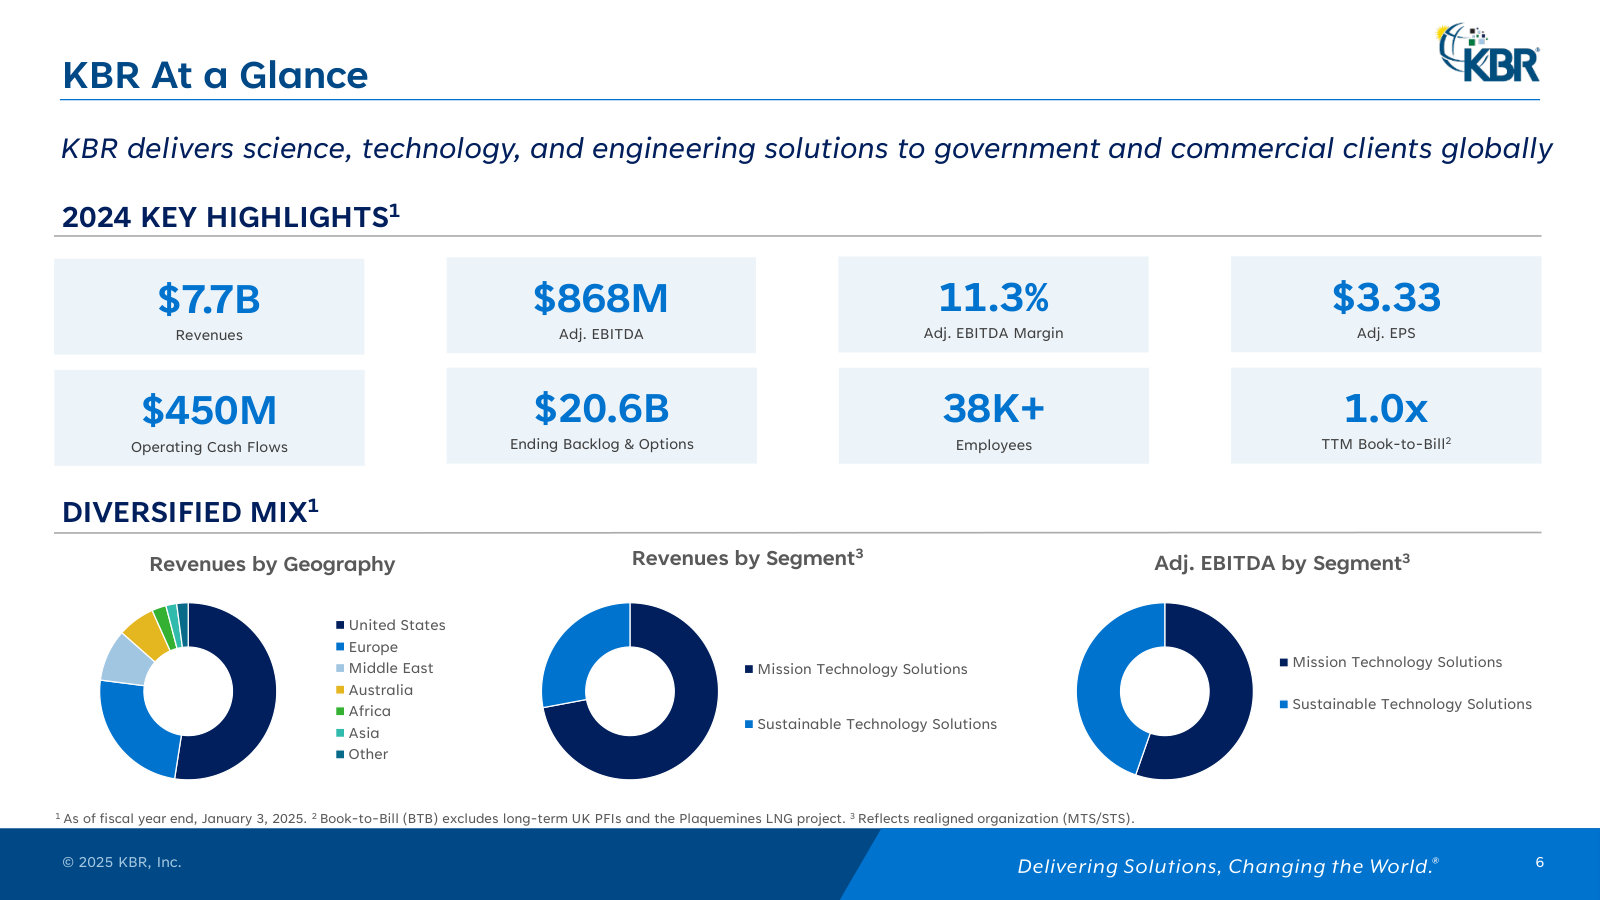
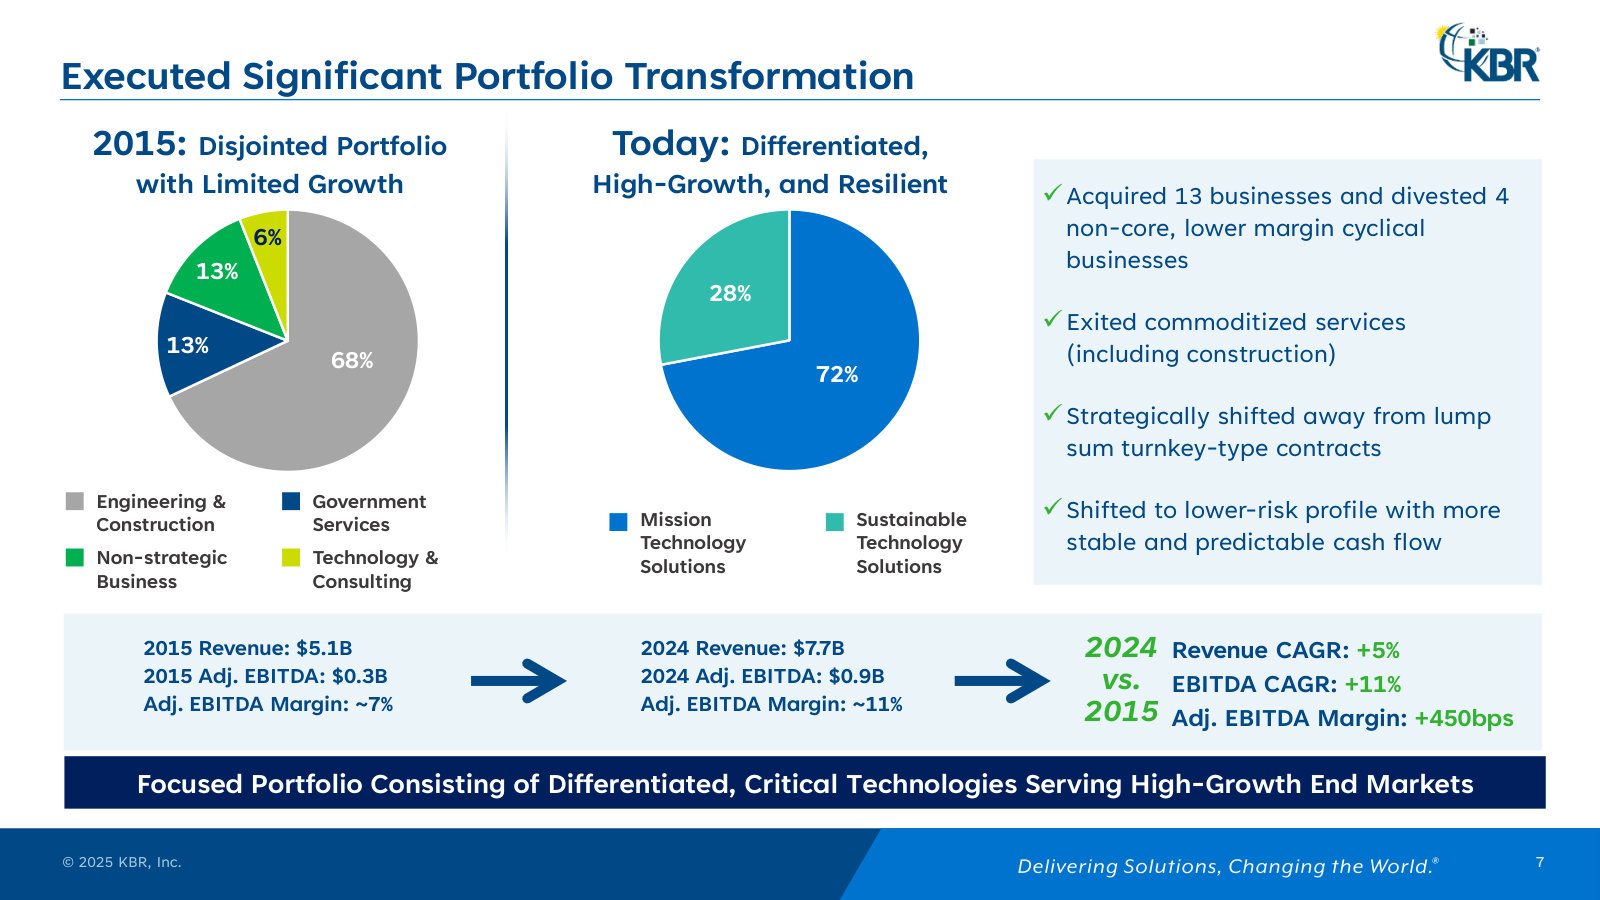
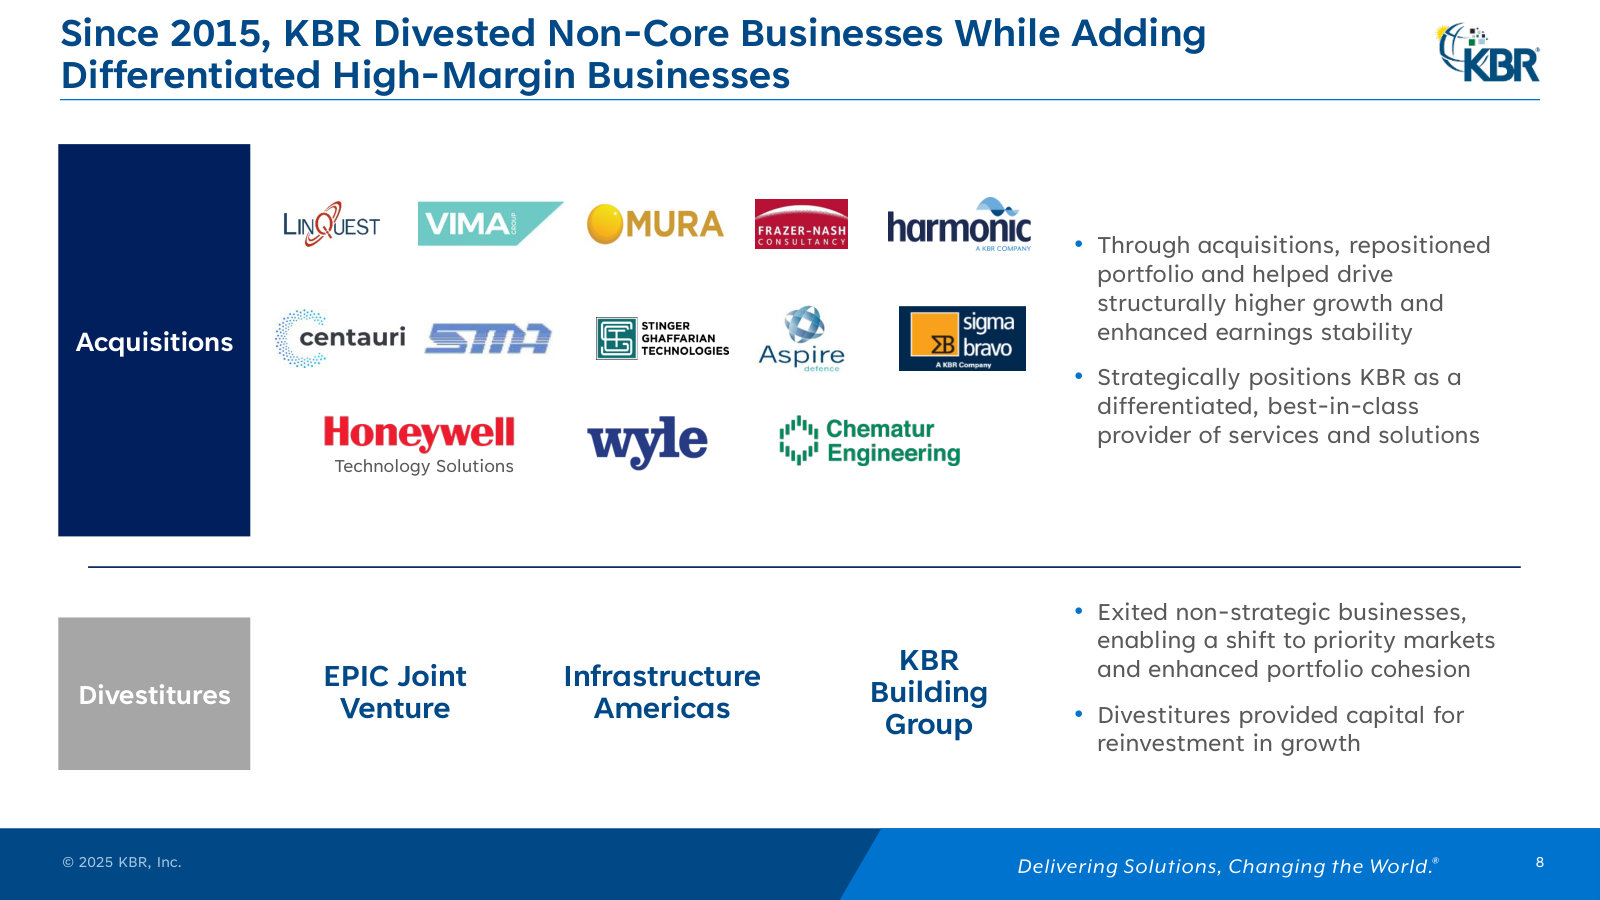
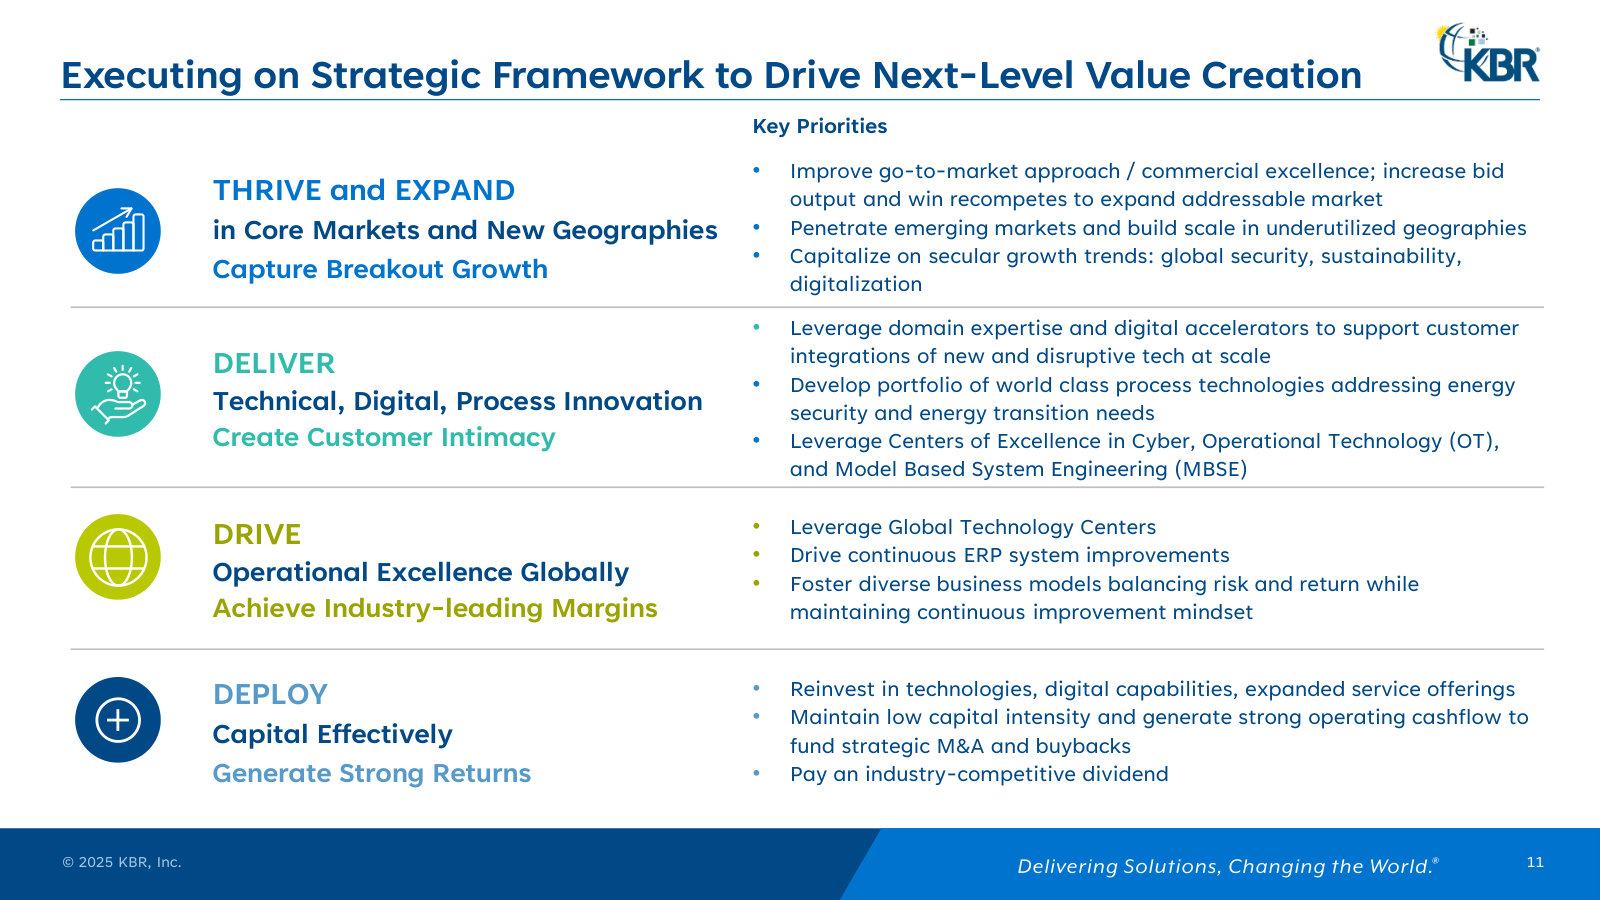
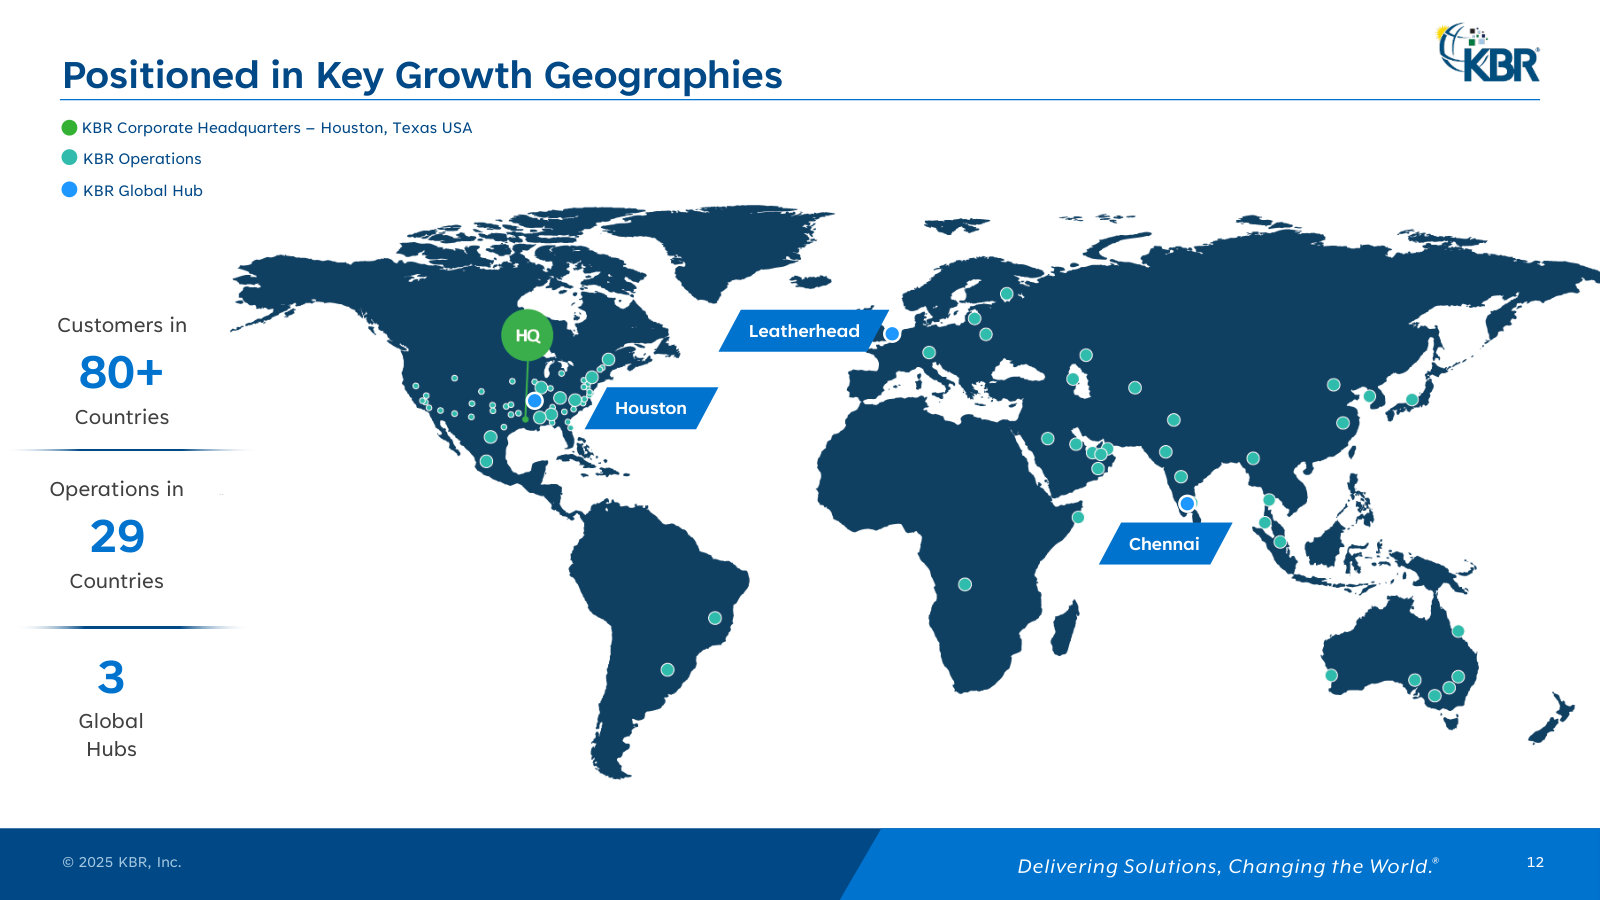
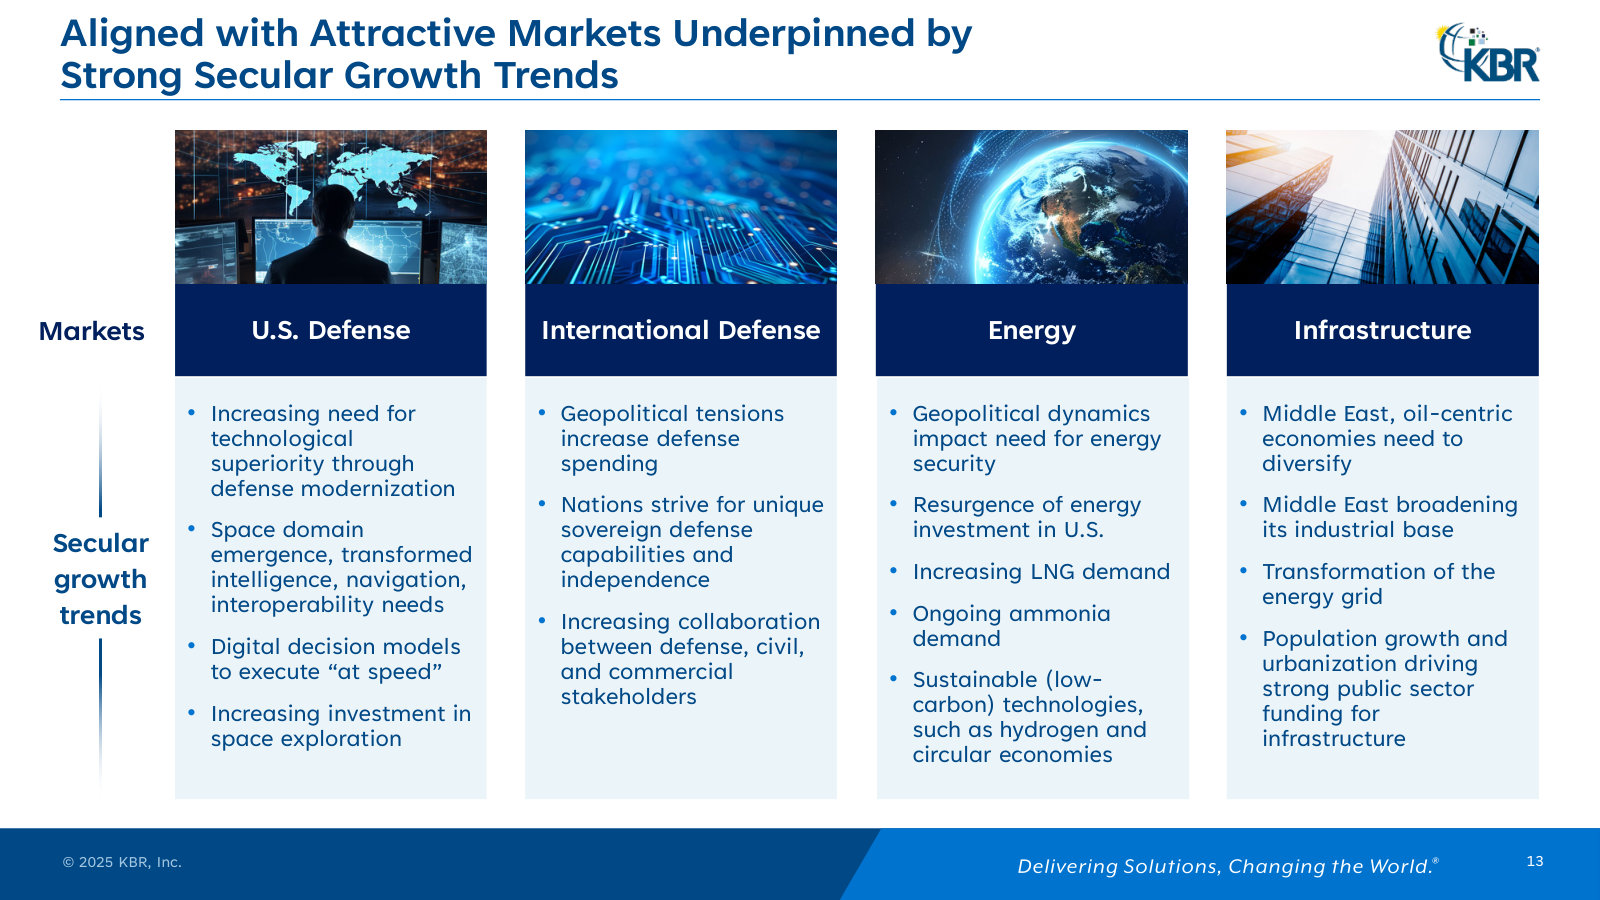
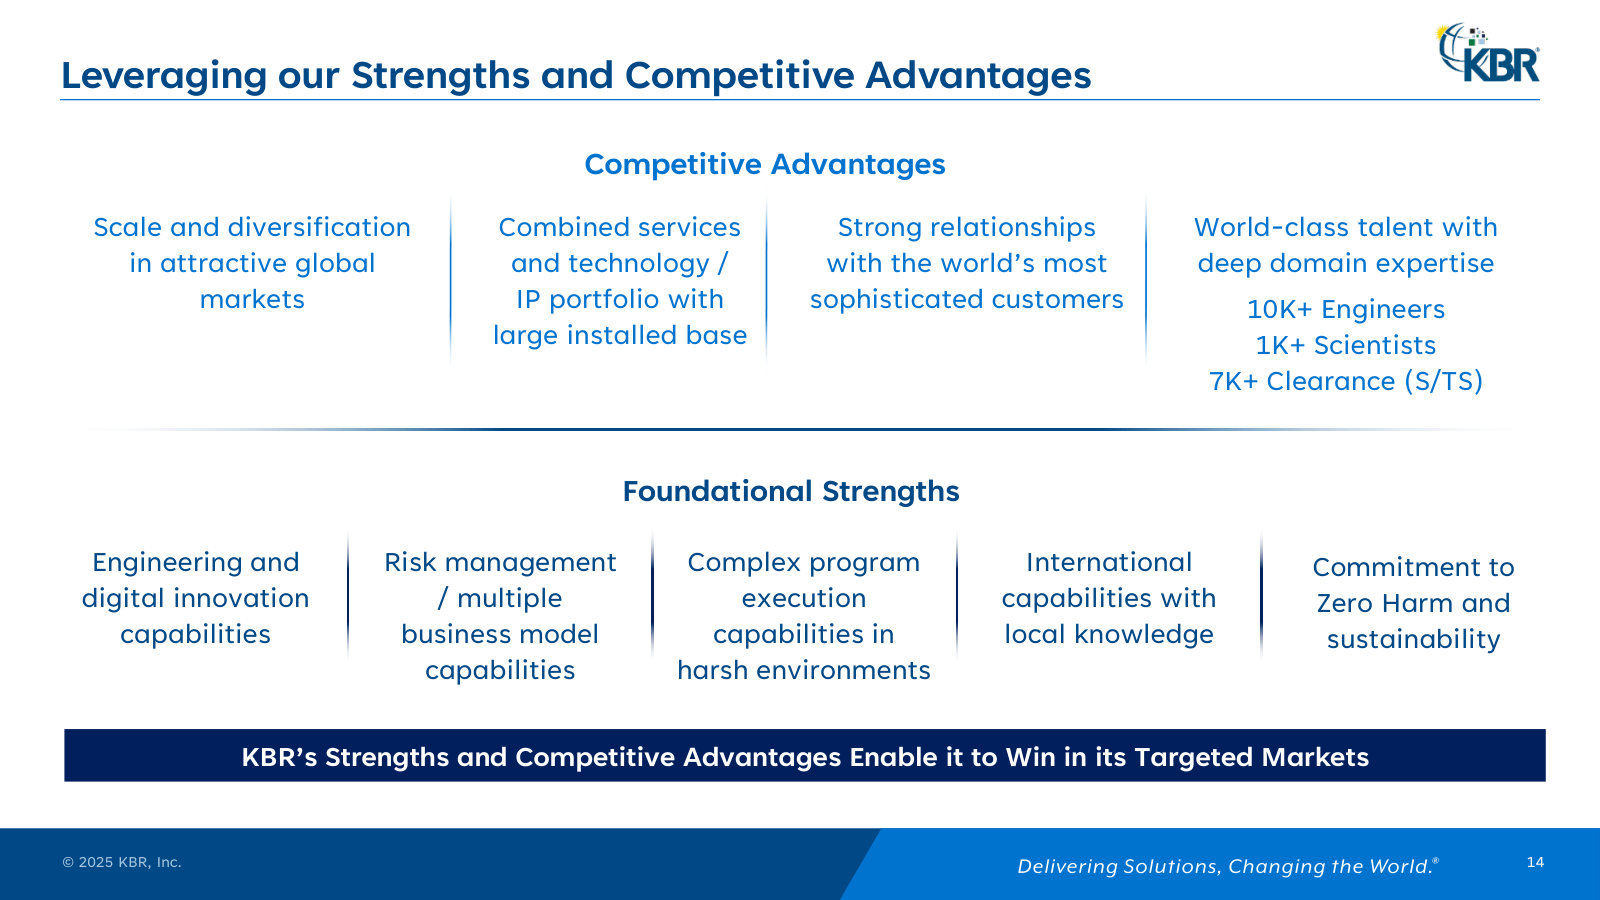
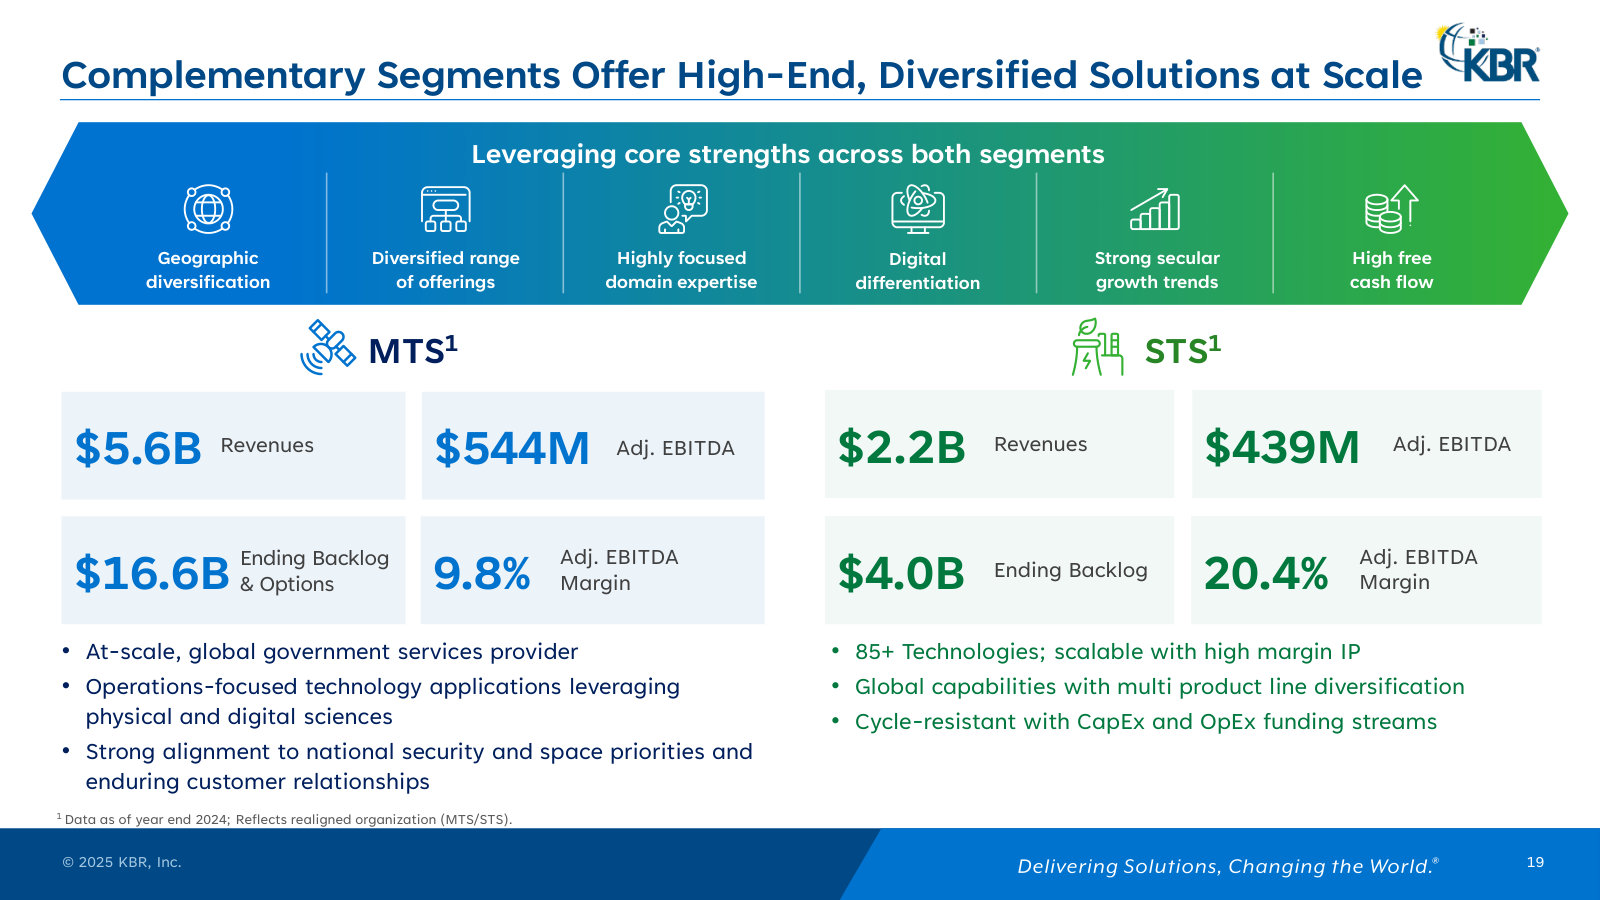
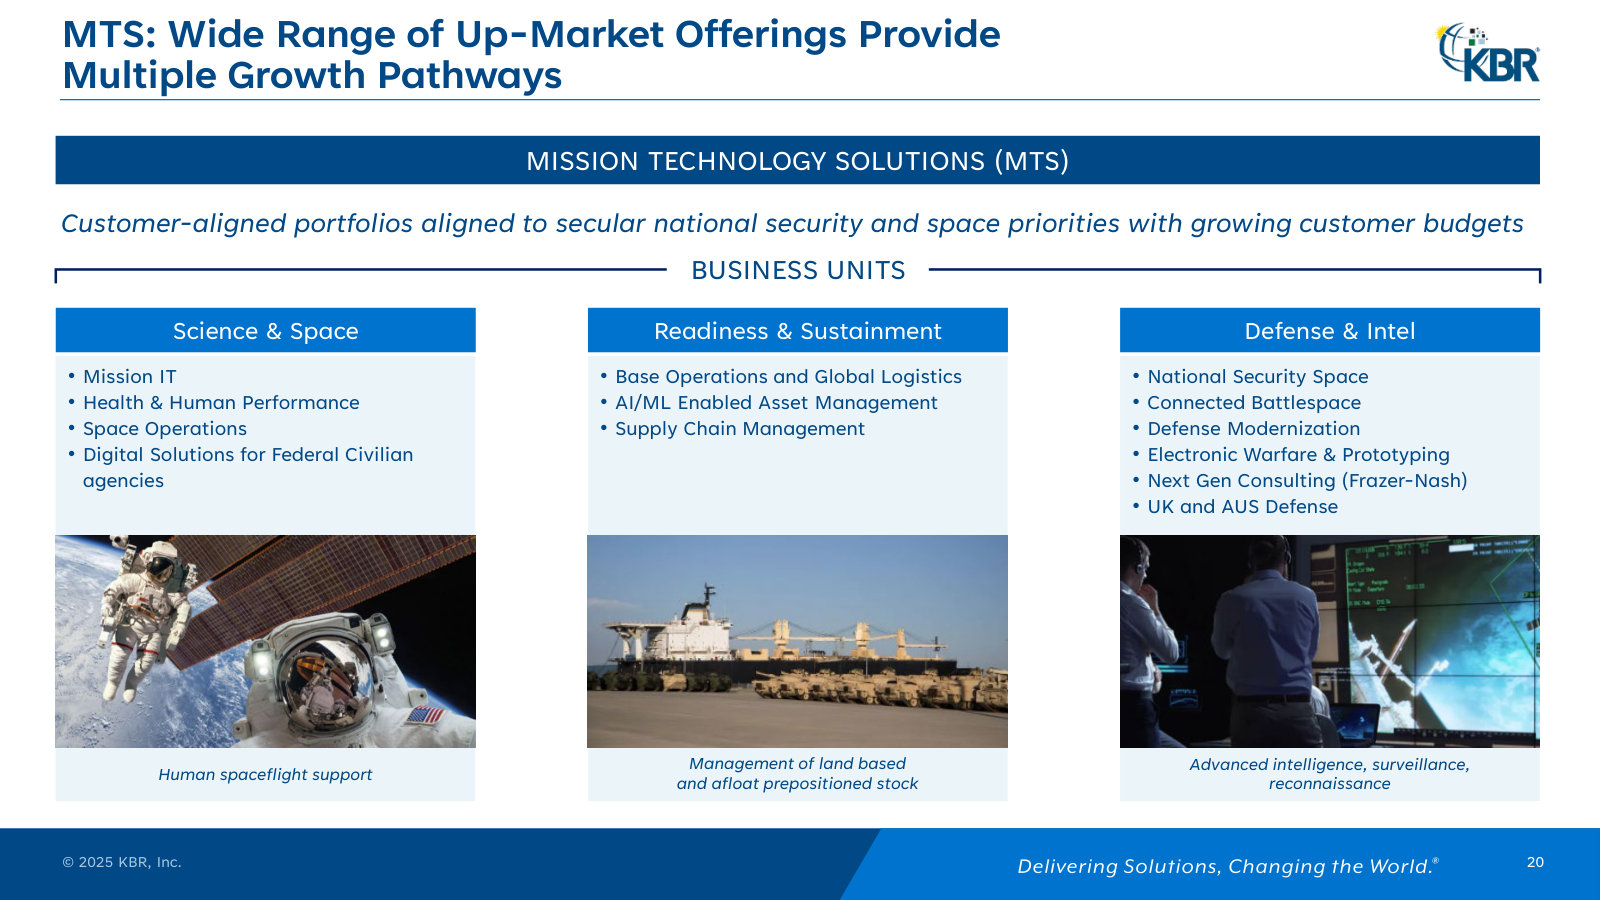
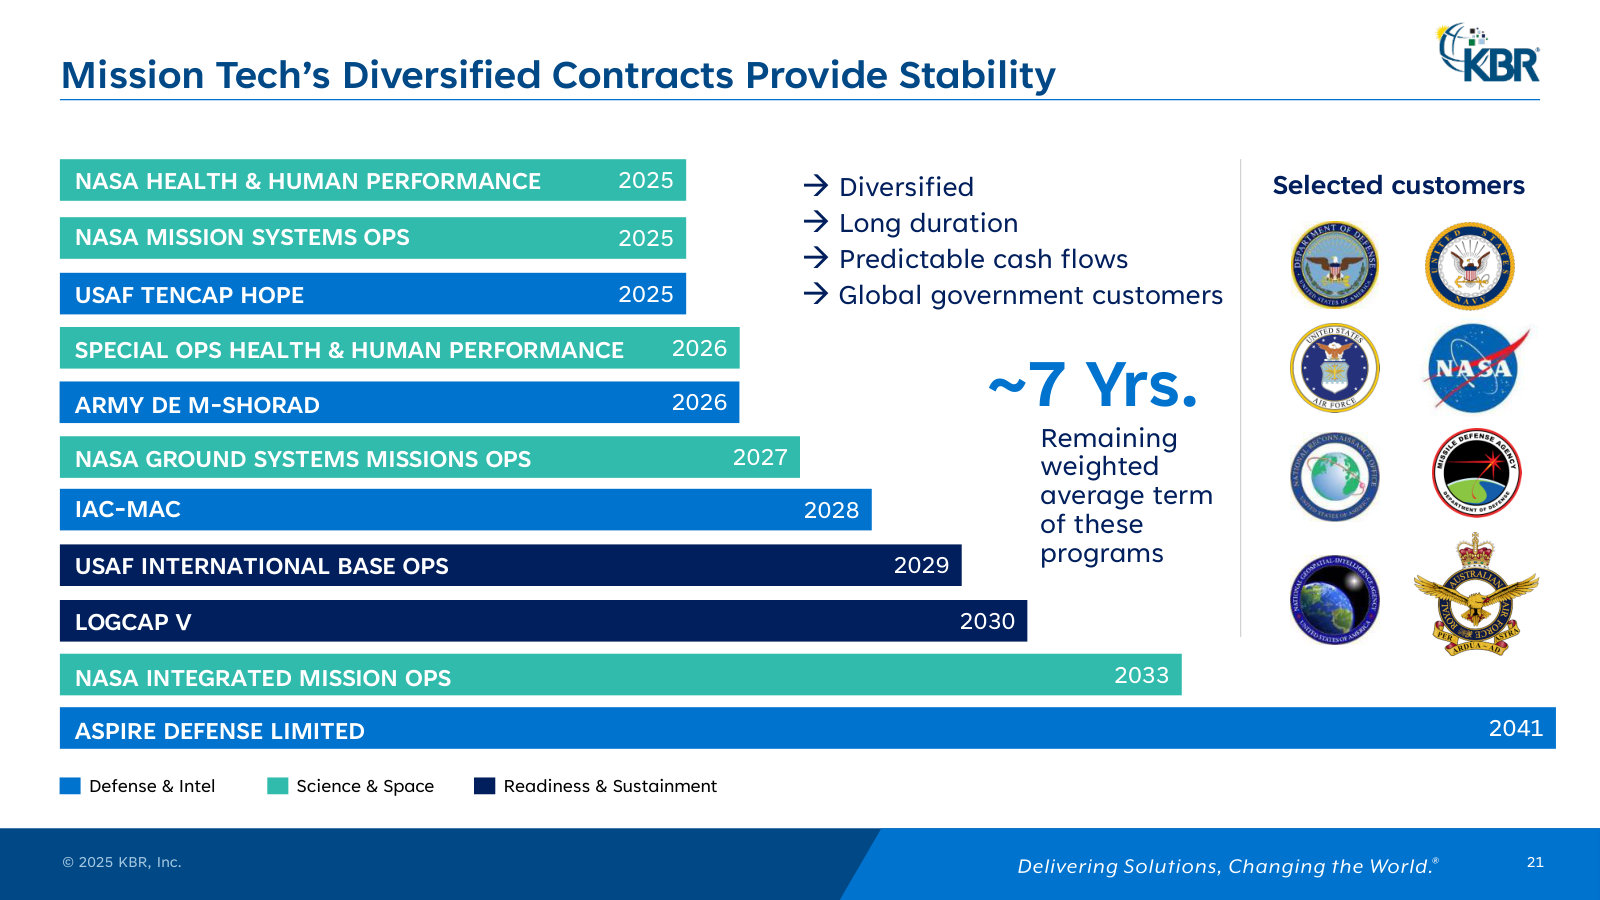
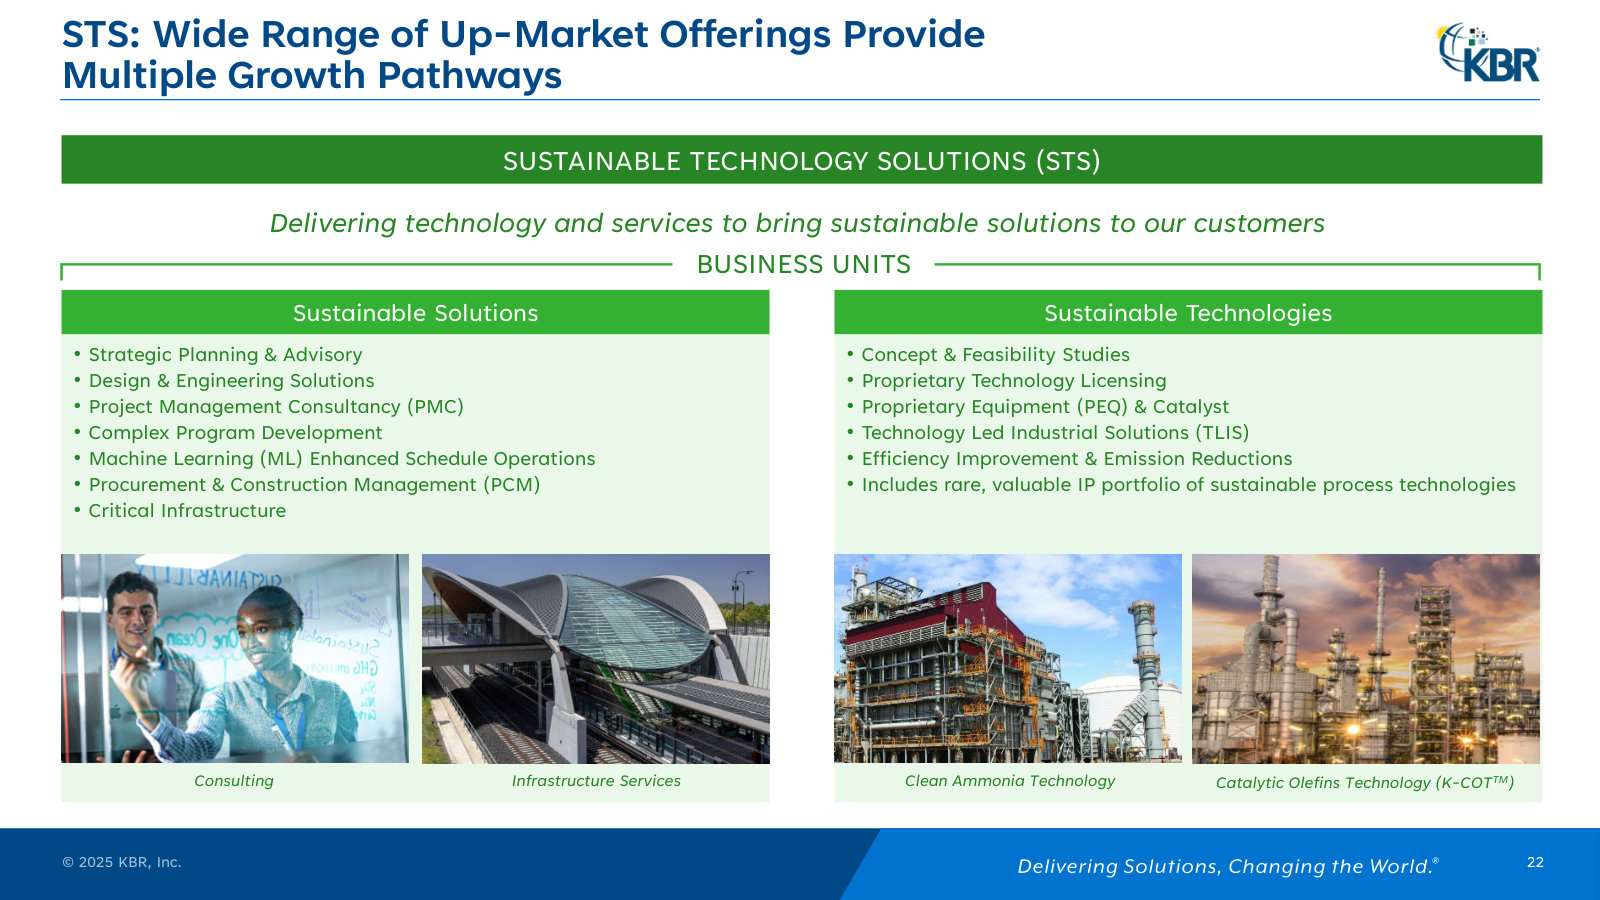
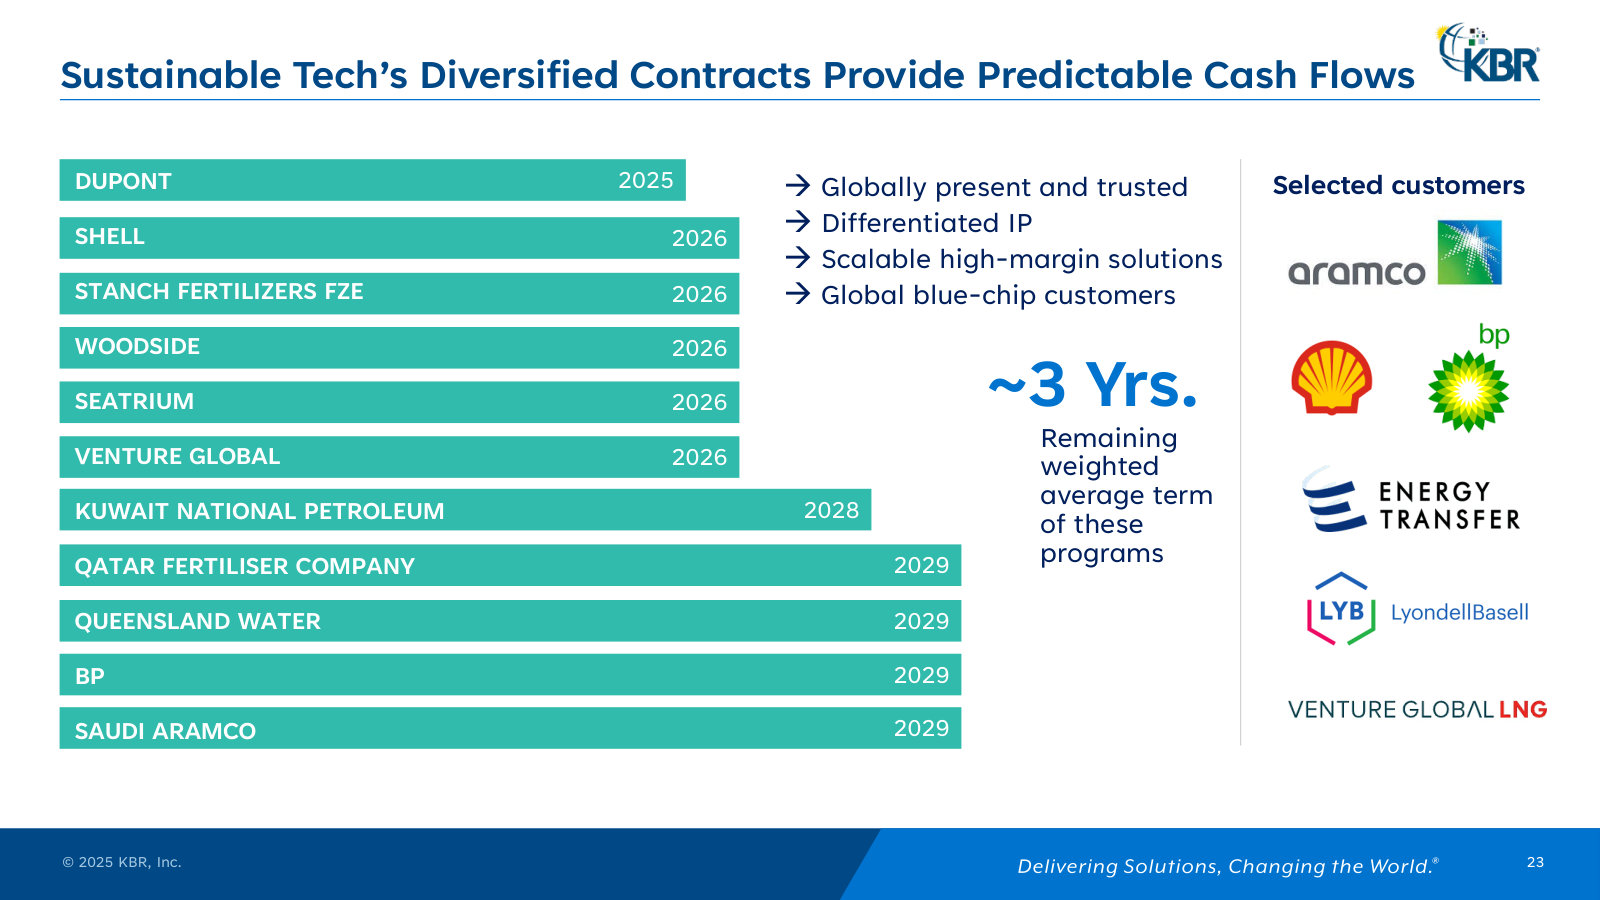
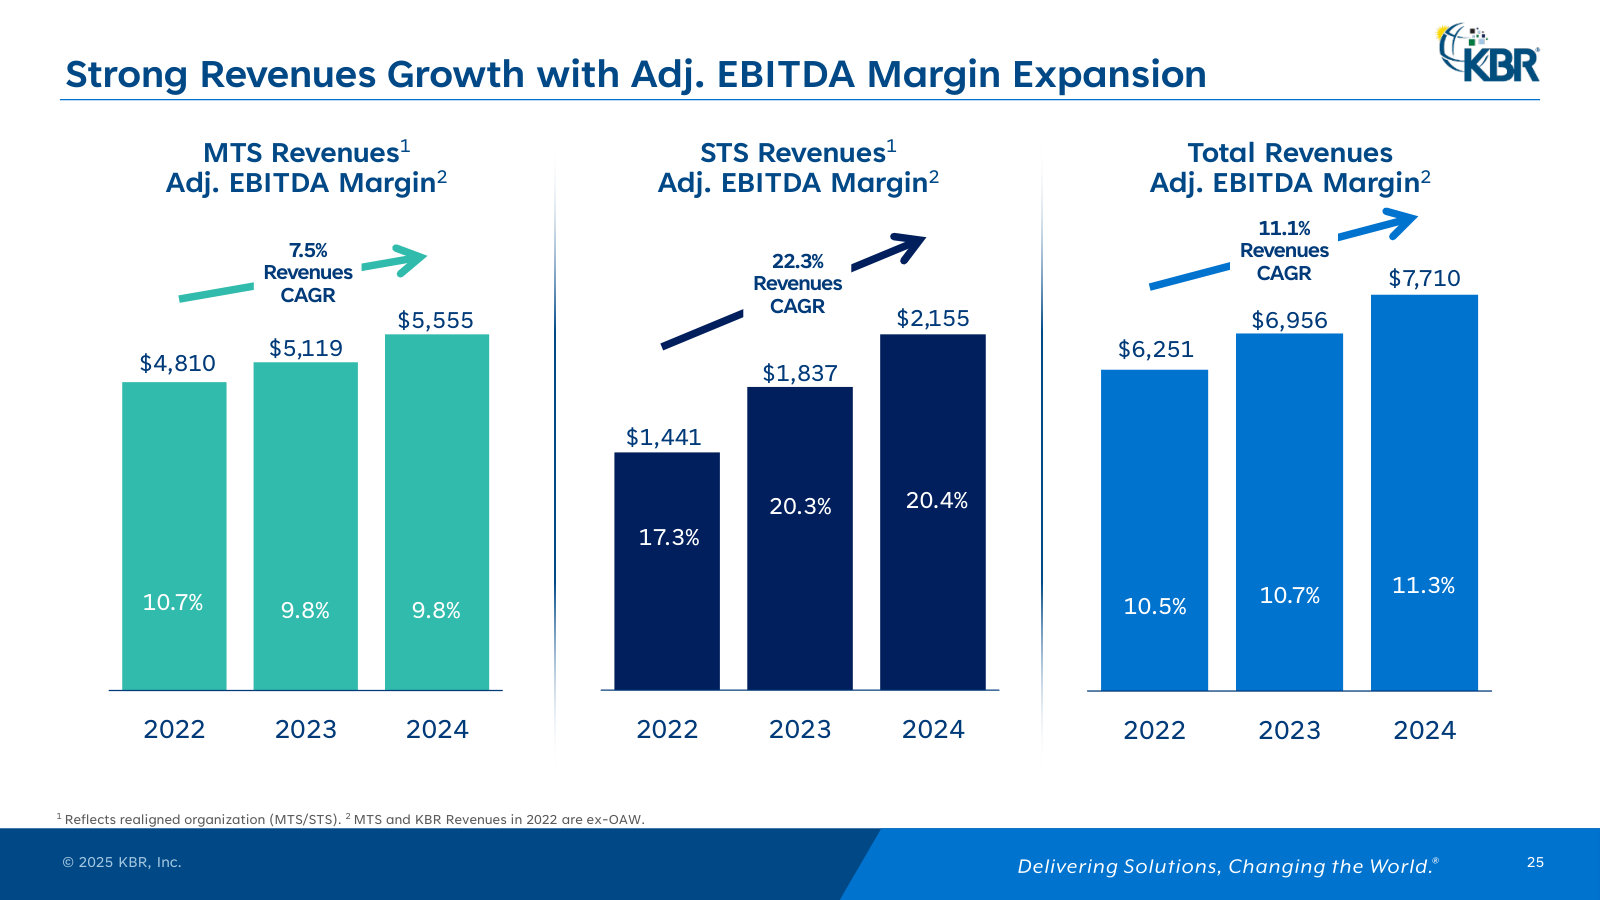
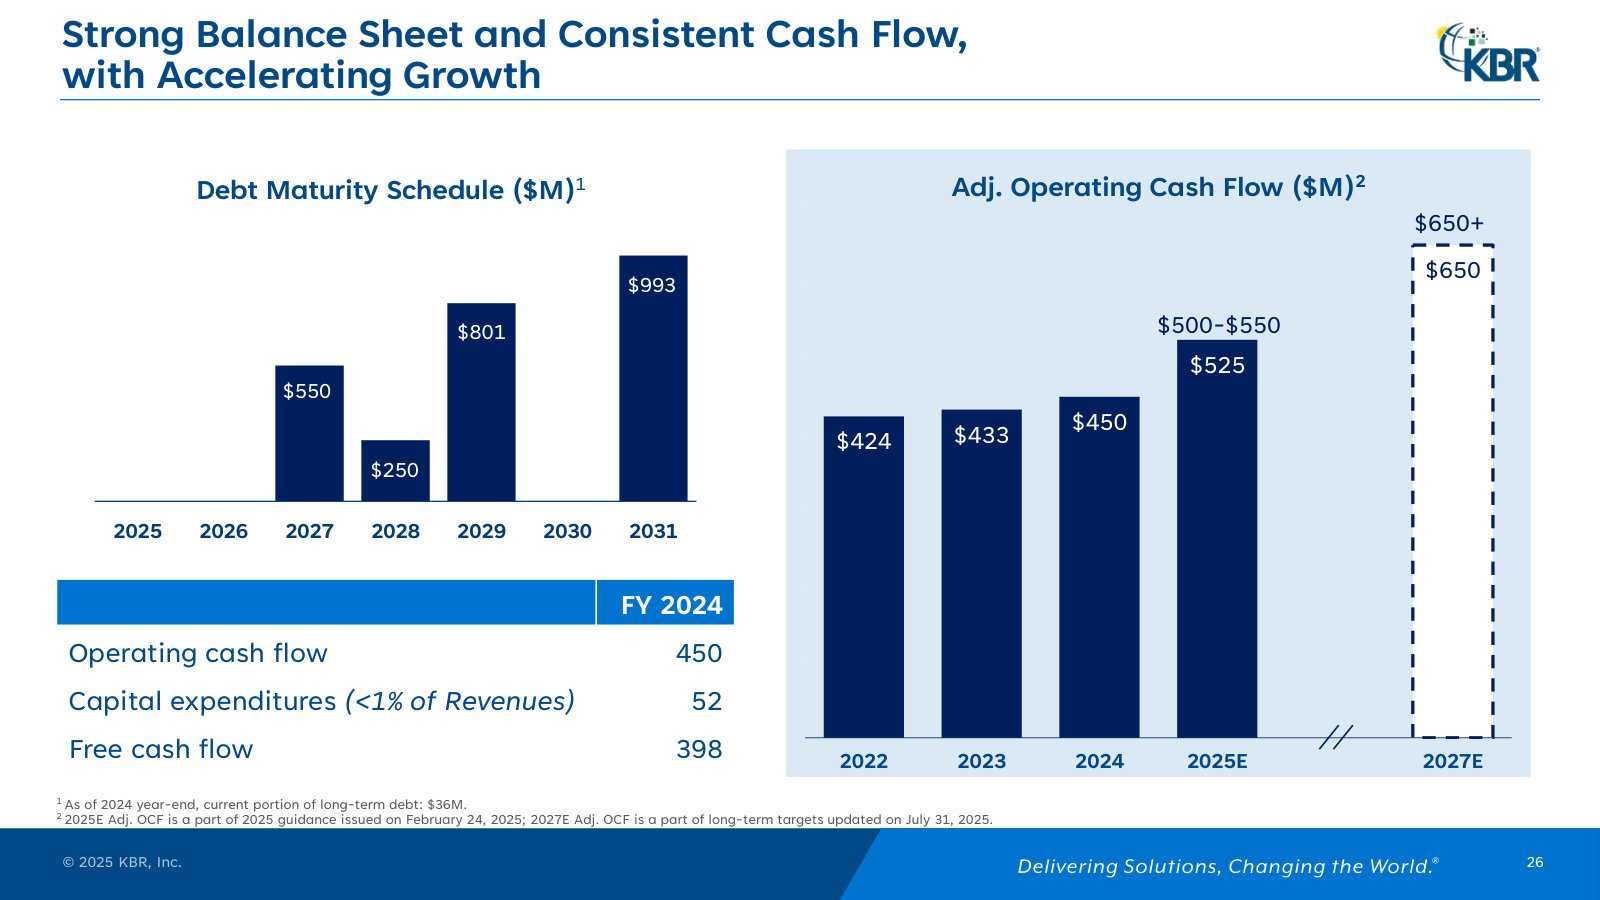
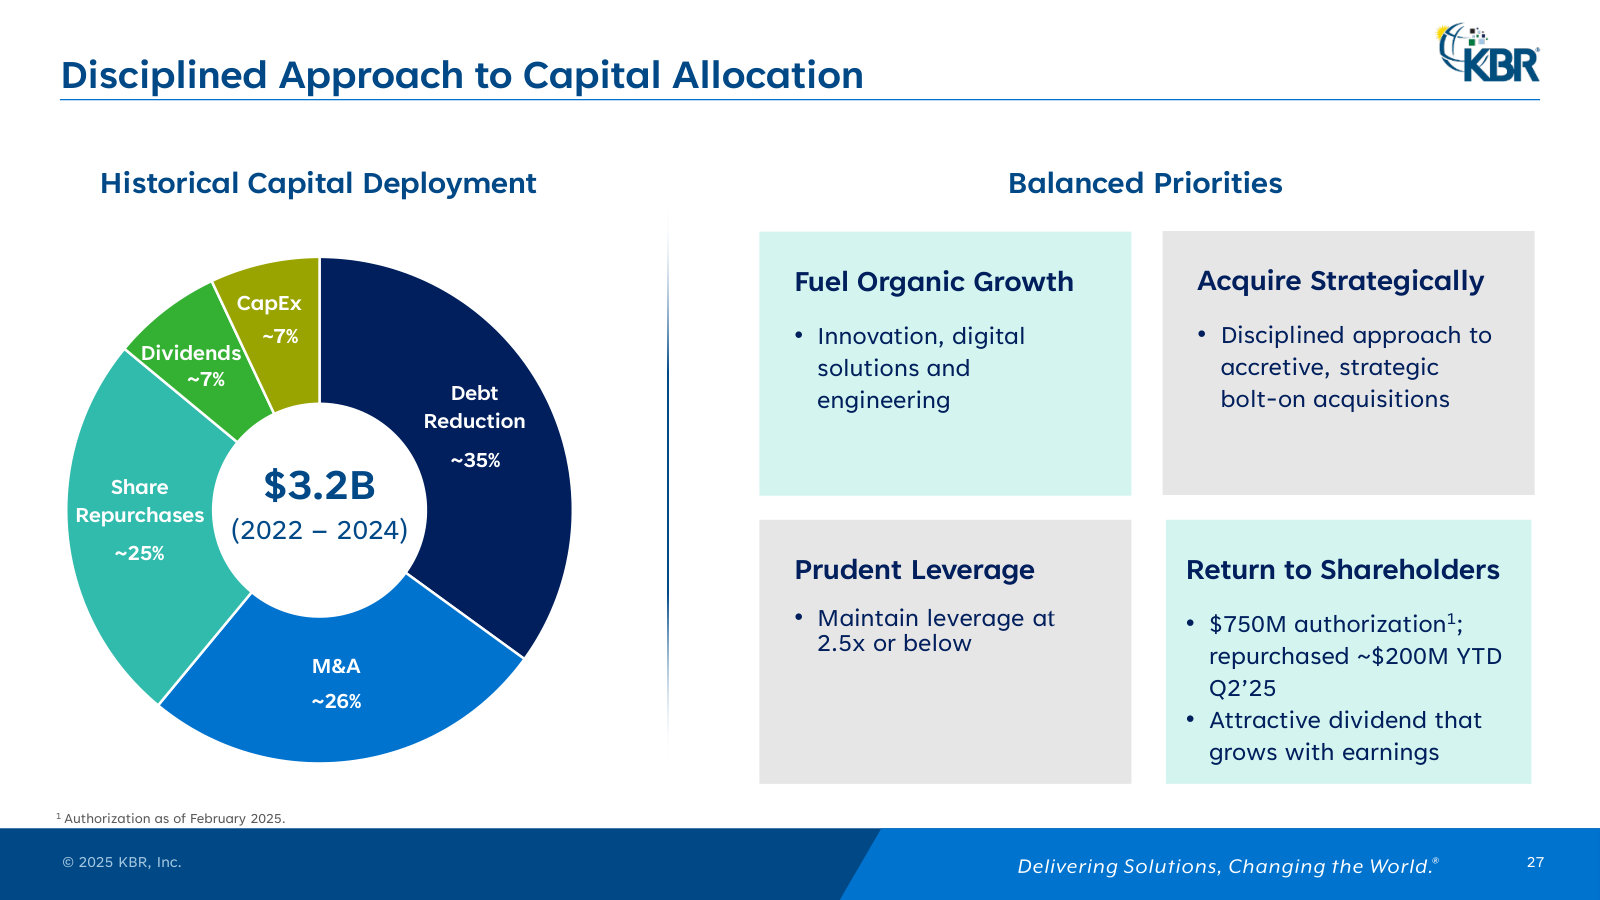
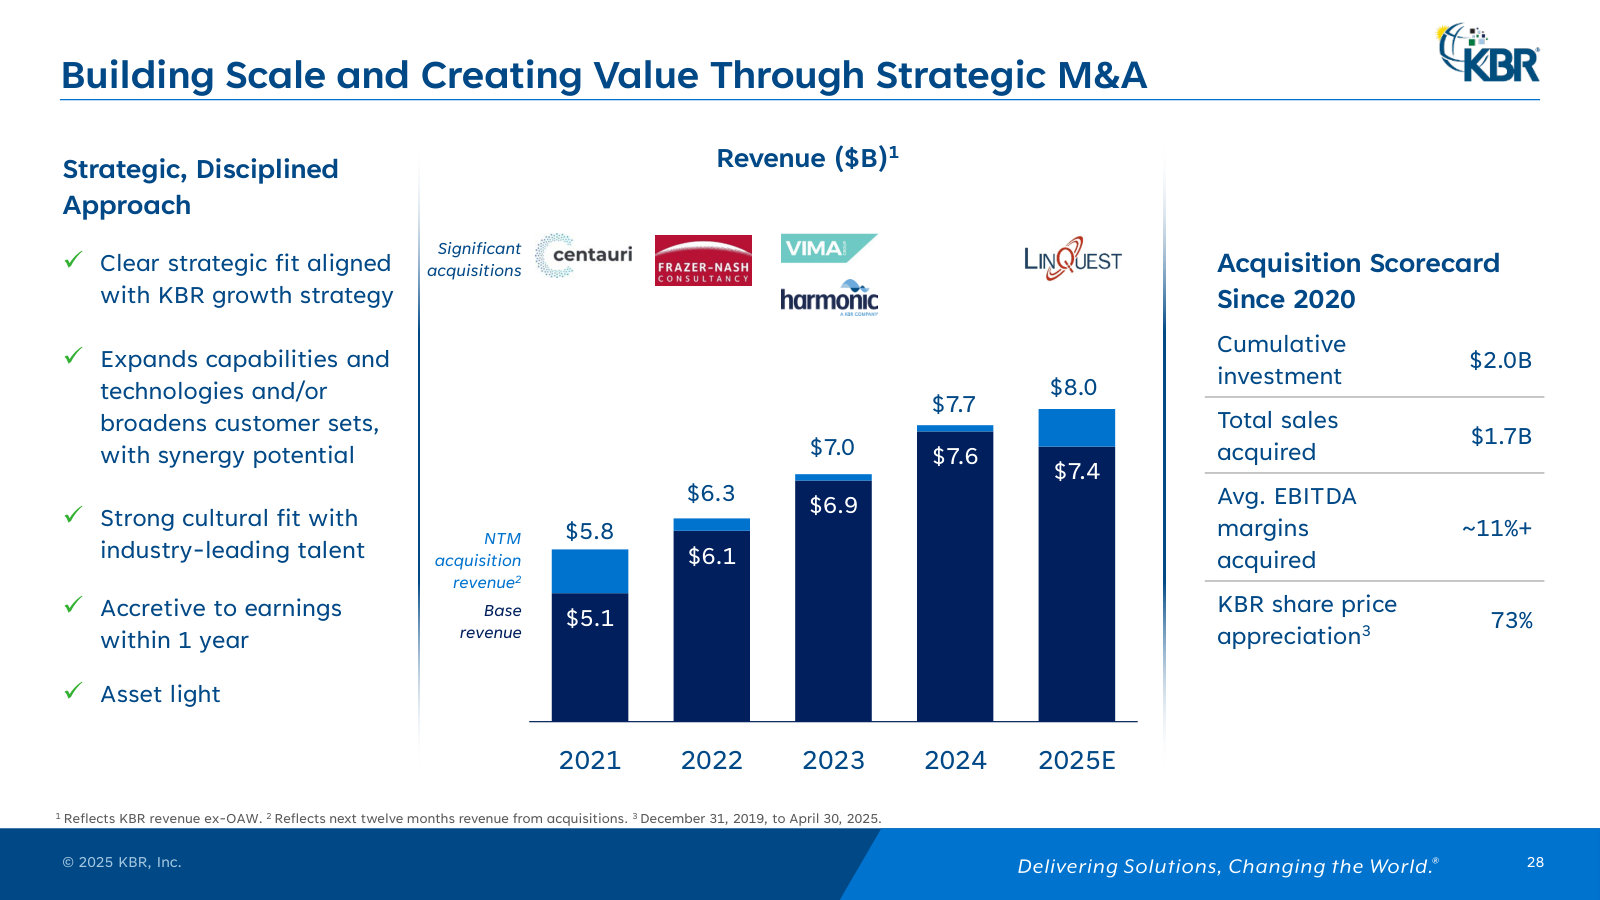
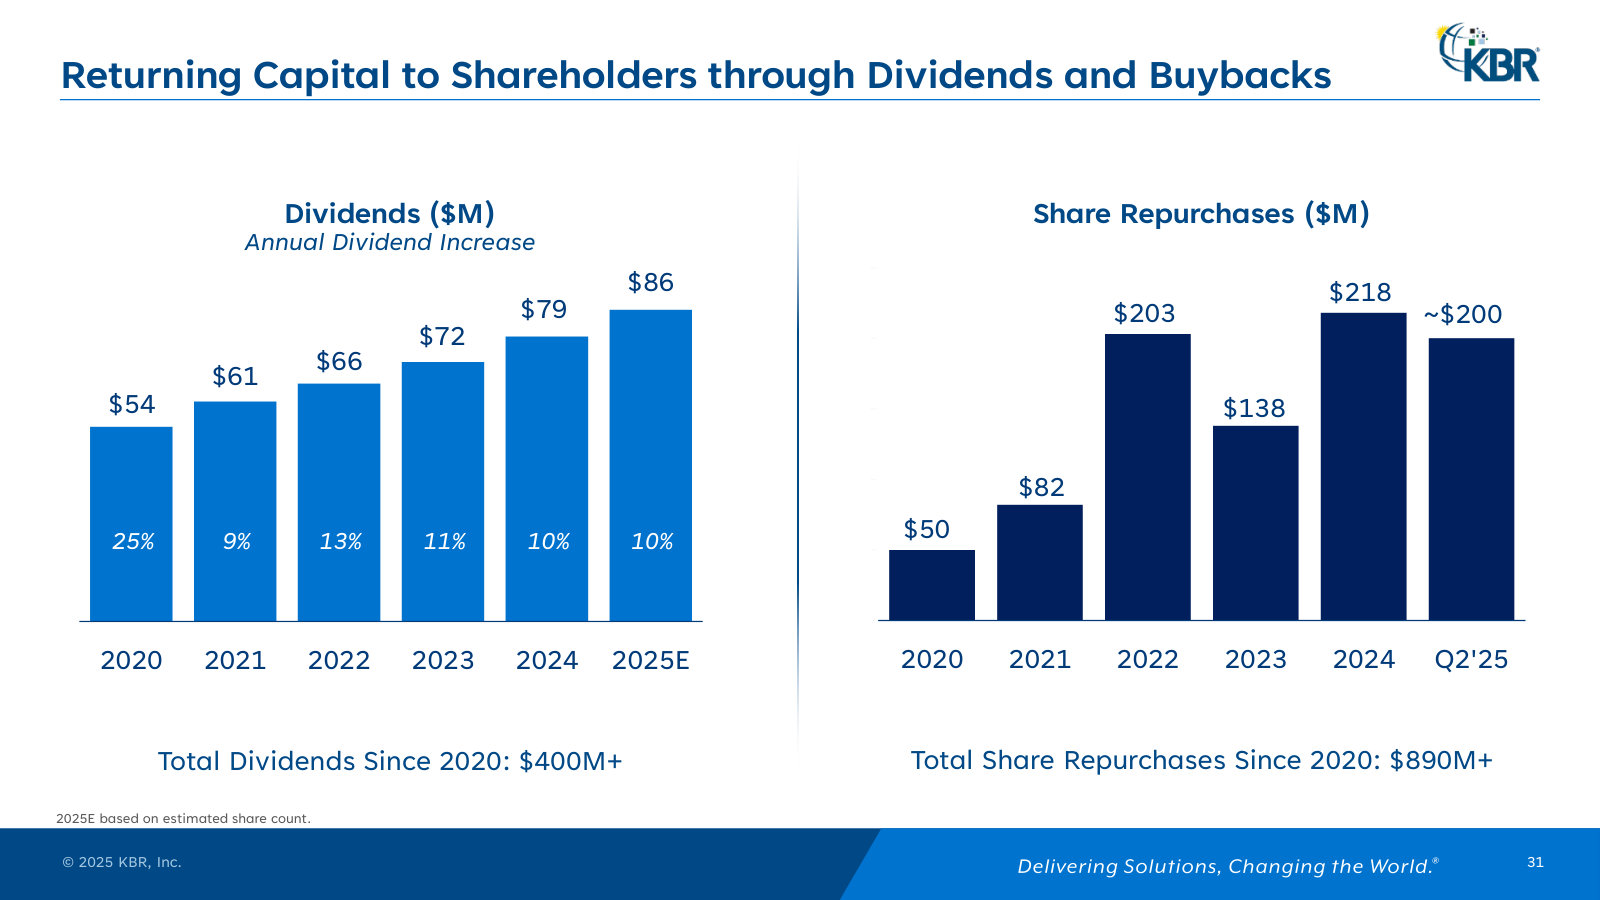
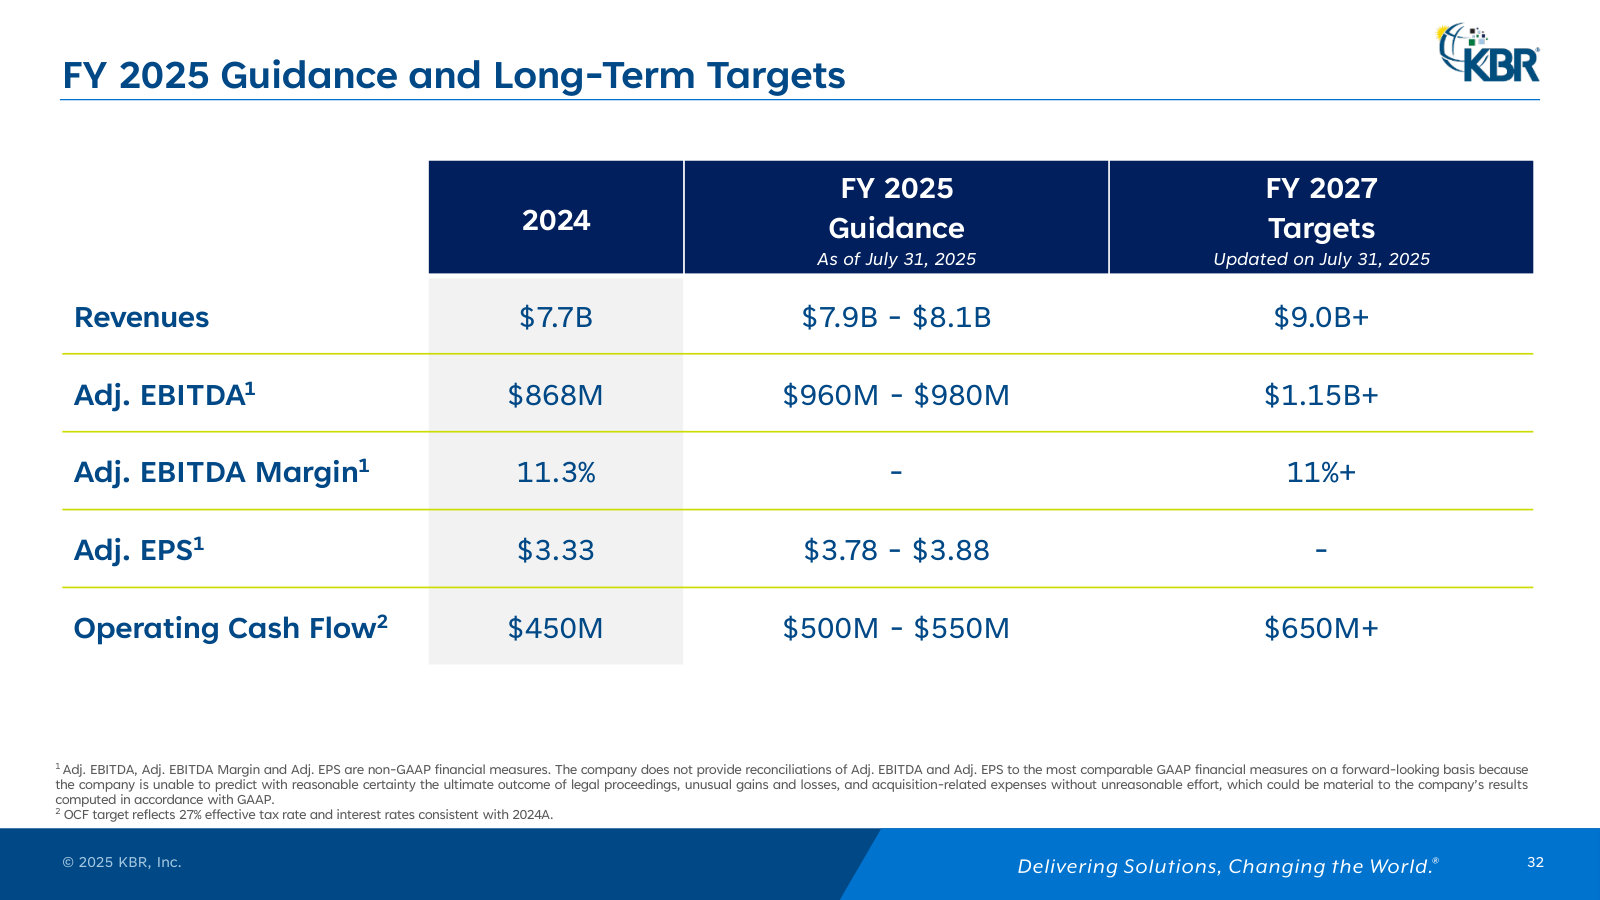
p. 5 — The five-point investment thesis management leads with — the up-market, low-capital, high-backlog story in its own words. · Open the full presentation →p. 6 — Snapshot: $7.7B revenue, $868M EBITDA, $20.6B backlog, plus the revenue and EBITDA split by segment and geography. · Open the full presentation →p. 7 — The portfolio remake — from a 68%-engineering/construction mix in 2015 to two tech-led segments today, with the margin gain. · Open the full presentation →p. 8 — How the remake happened: 13 acquisitions (Centauri, Frazer-Nash, LinQuest…) and the divestitures that funded them. · Open the full presentation →p. 11 — The strategic framework in four verbs — Thrive/Expand, Deliver, Drive, Deploy — and the priorities under each. · Open the full presentation →p. 12 — Global footprint: customers in 80+ countries, operations in 29, three hubs (Houston, Leatherhead, Chennai). · Open the full presentation →p. 13 — The four end-markets and the secular trends behind them — U.S. and international defense, energy, infrastructure. · Open the full presentation →p. 14 — What management argues sets KBR apart: scale, an IP/services portfolio, sticky customers and cleared technical talent. · Open the full presentation →p. 19 — The two segments side by side — MTS $5.6B revenue at 9.8% margin, STS $2.2B at 20.4% — and their backlogs. · Open the full presentation →p. 20 — Inside Mission Technology Solutions: the three business units — Science & Space, Readiness & Sustainment, Defense & Intel. · Open the full presentation →p. 21 — MTS's contract book — long-dated government programs running to 2041, ~7-year weighted term, and the key agencies behind them. · Open the full presentation →p. 22 — Inside Sustainable Technology Solutions: consulting and services plus a proprietary process-technology and catalyst IP portfolio. · Open the full presentation →p. 23 — STS's contract book — blue-chip energy customers (Aramco, Shell, BP…) on a ~3-year weighted average term. · Open the full presentation →p. 25 — Segment revenue and margin trend, 2022-24 — STS growing fastest (22% CAGR) near 20% margins; MTS the larger, steadier base. · Open the full presentation →p. 26 — Balance sheet and cash: the debt maturity ladder, rising operating cash flow and sub-1%-of-revenue capex. · Open the full presentation →p. 27 — Where the cash went, 2022-24: $3.2B split across debt paydown, M&A, buybacks and dividends, with the stated priorities. · Open the full presentation →p. 28 — The M&A engine quantified — acquisitions lifting revenue toward $8B; $2.0B invested for $1.7B of sales at 11%+ margins. · Open the full presentation →p. 31 — Capital returns: a steadily raised dividend and $890M+ of buybacks since 2020. · Open the full presentation →p. 32 — The guidance and 2027 targets management is measured against — FY25 plus the $9B+ revenue / $1.15B+ EBITDA goalposts. · Open the full presentation →
The latest full-year results and the headline event — KBR's planned tax-free split into two companies — with FY26 guidance. · Open the full document →
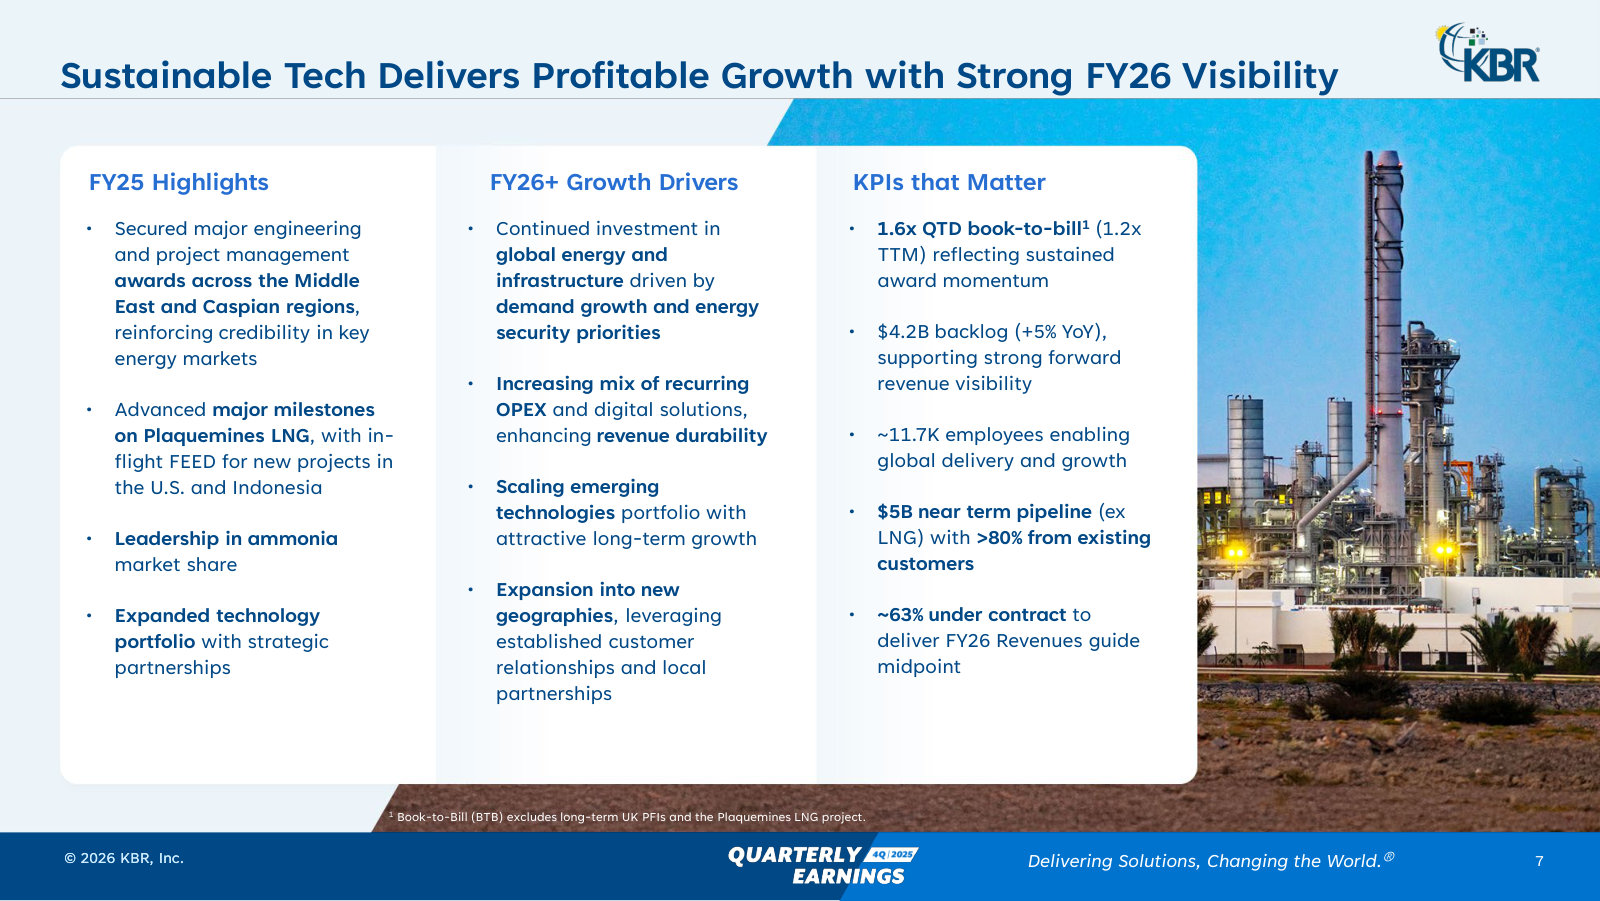
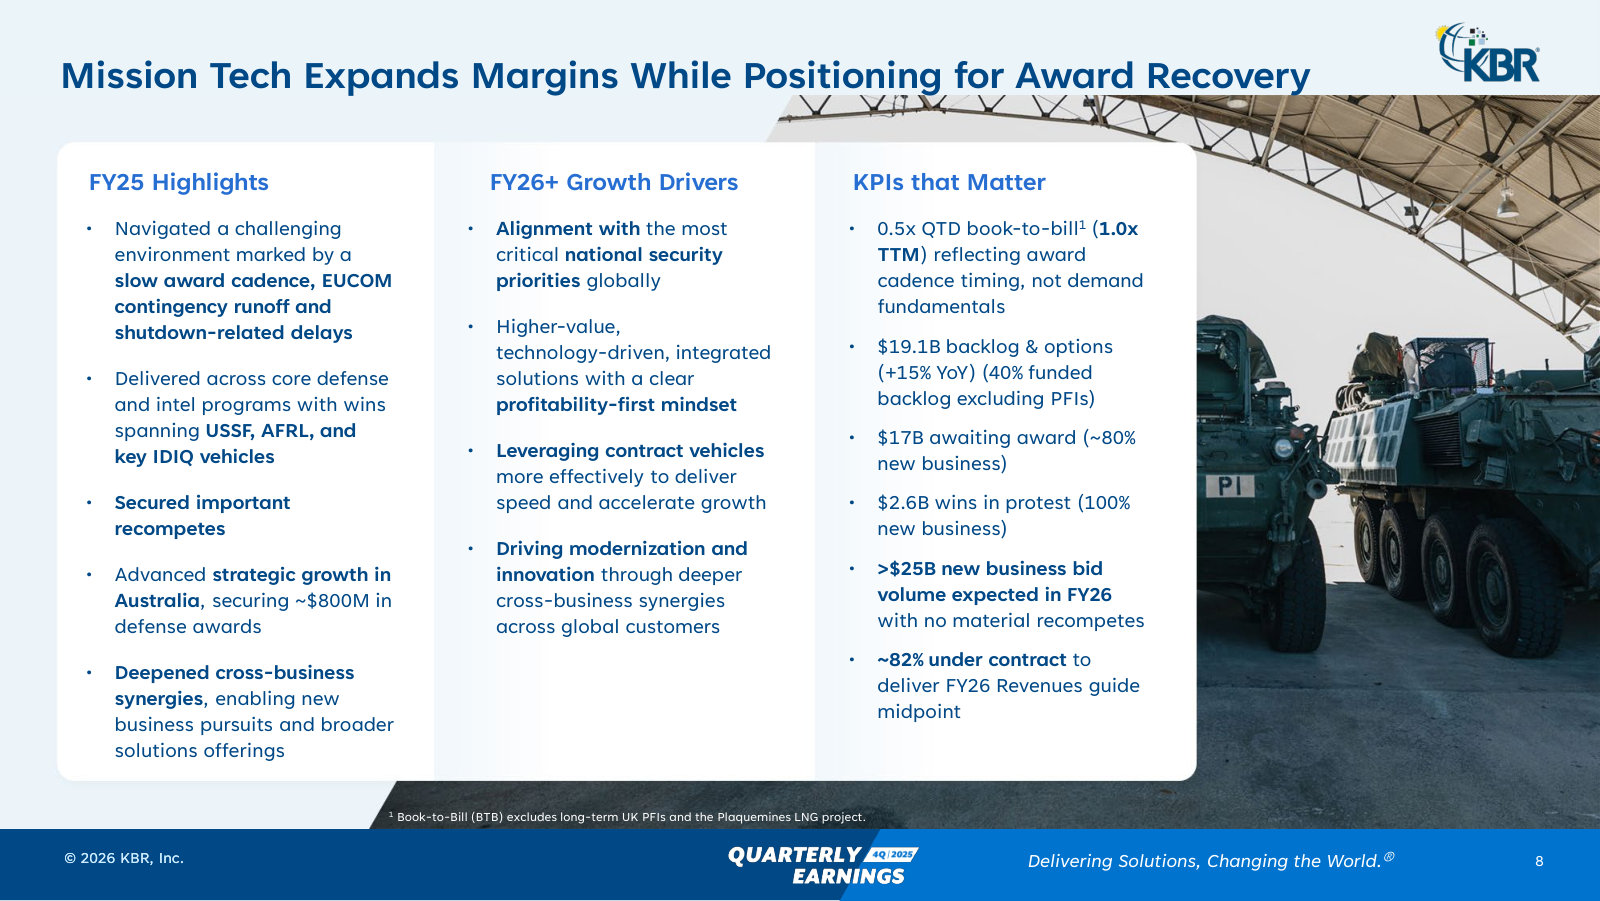
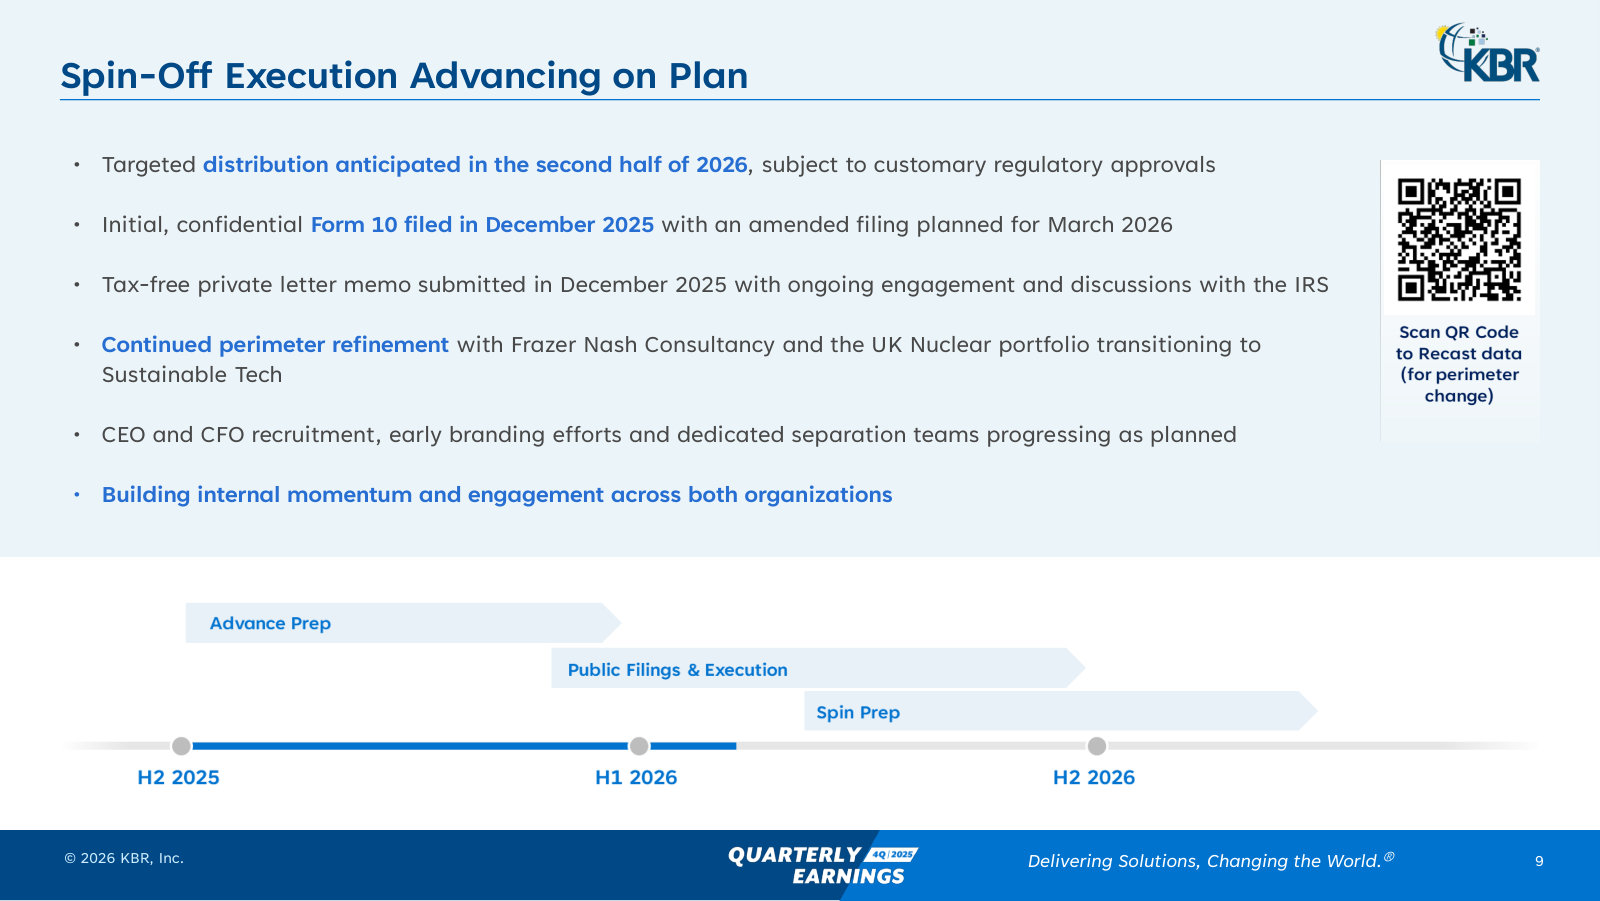
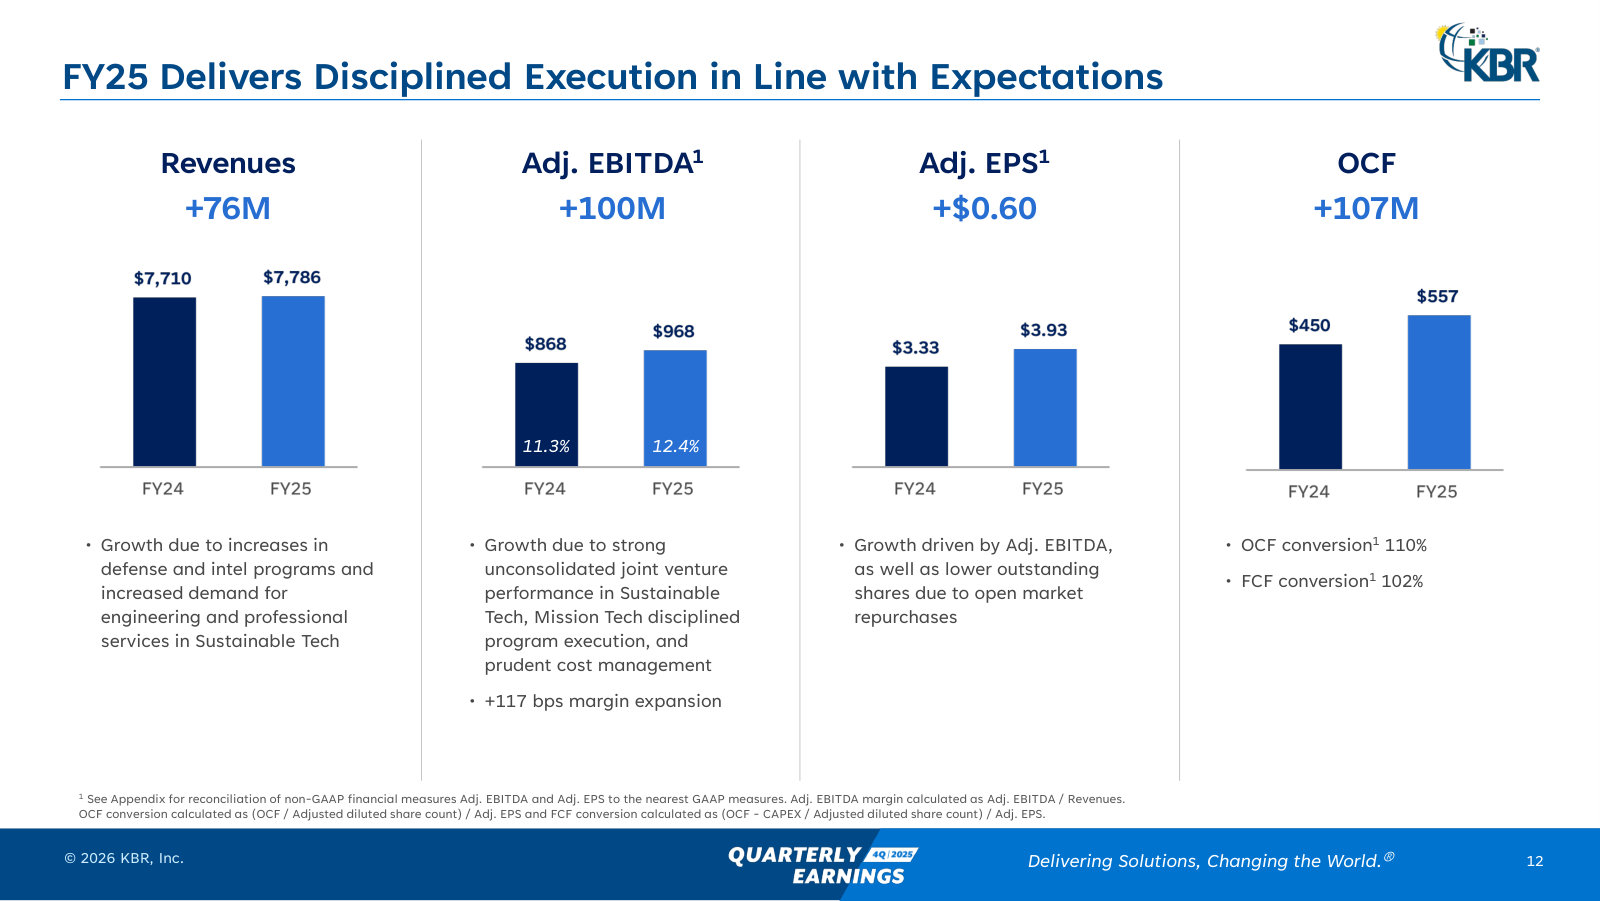
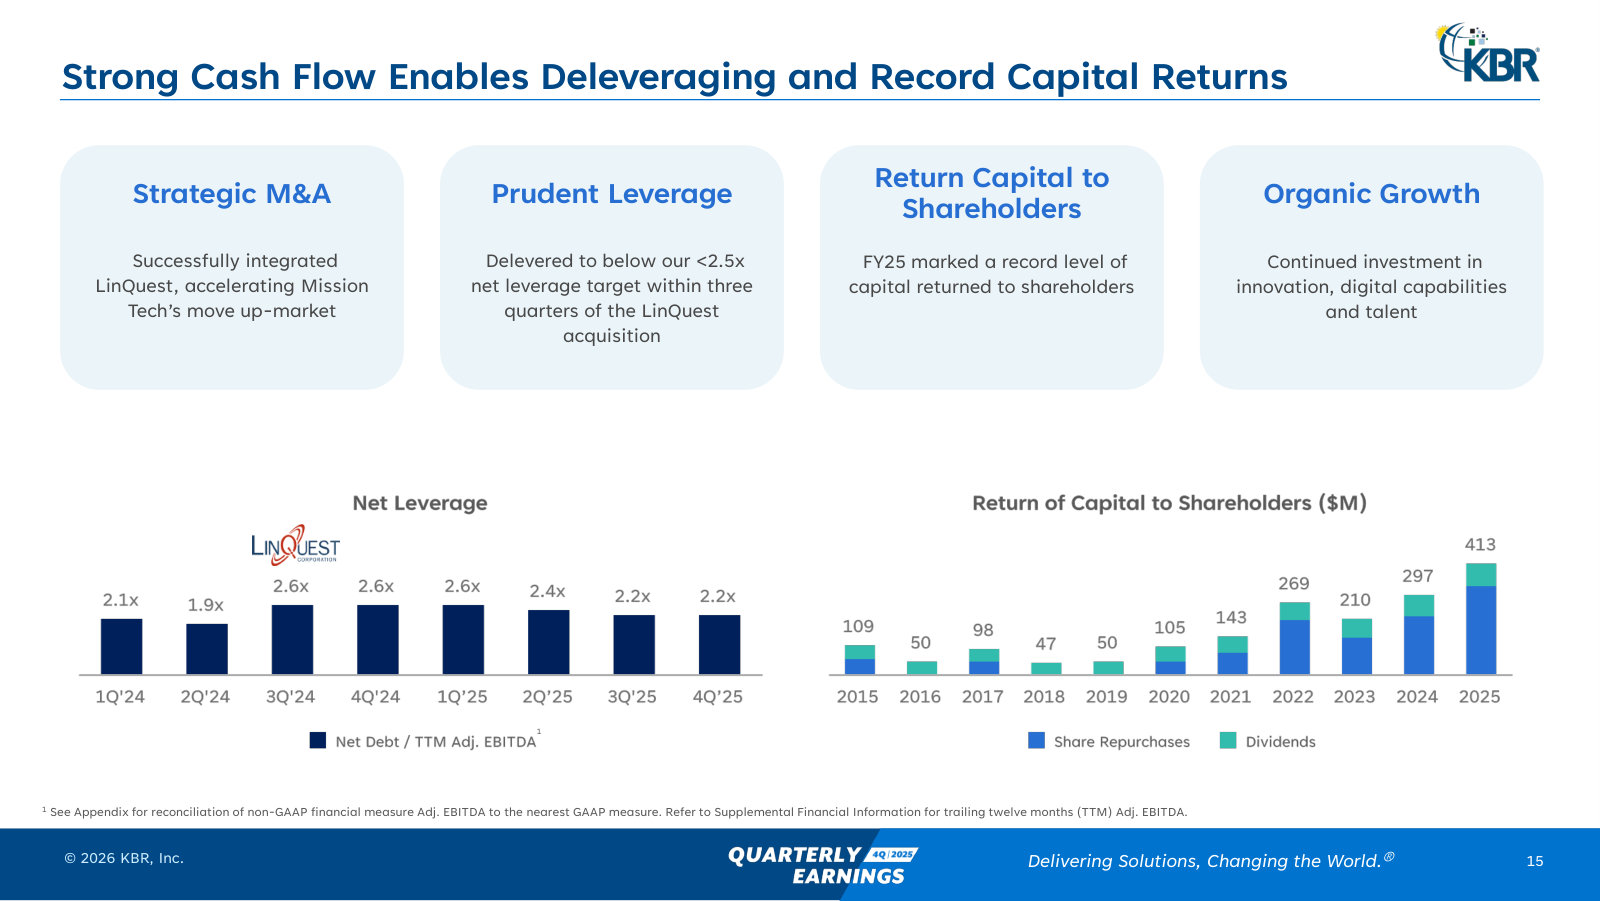
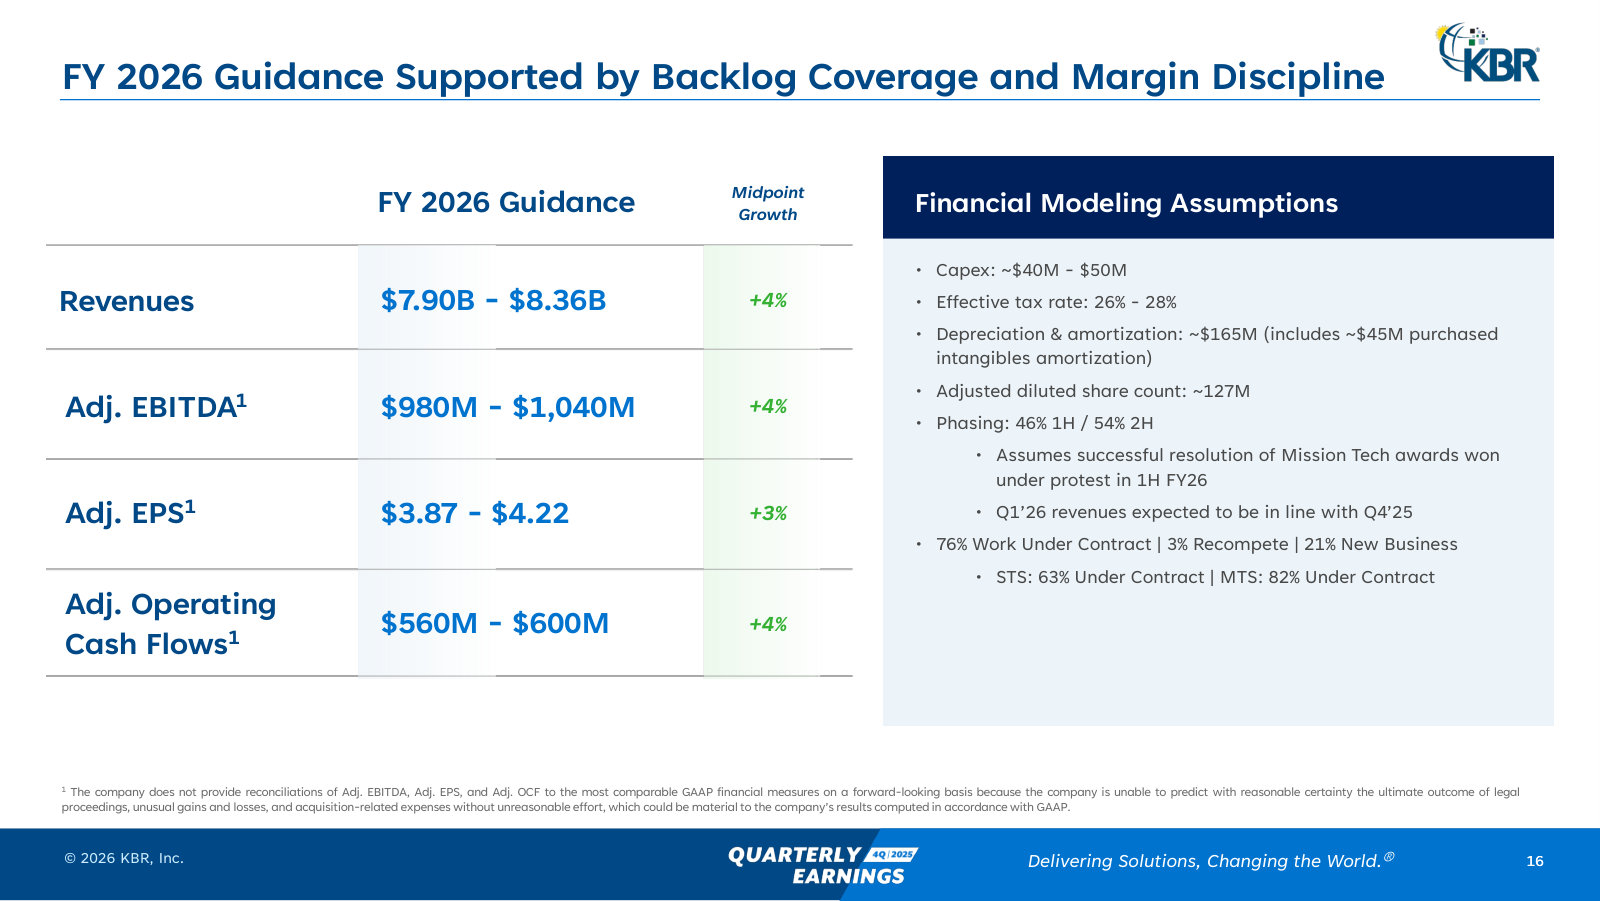
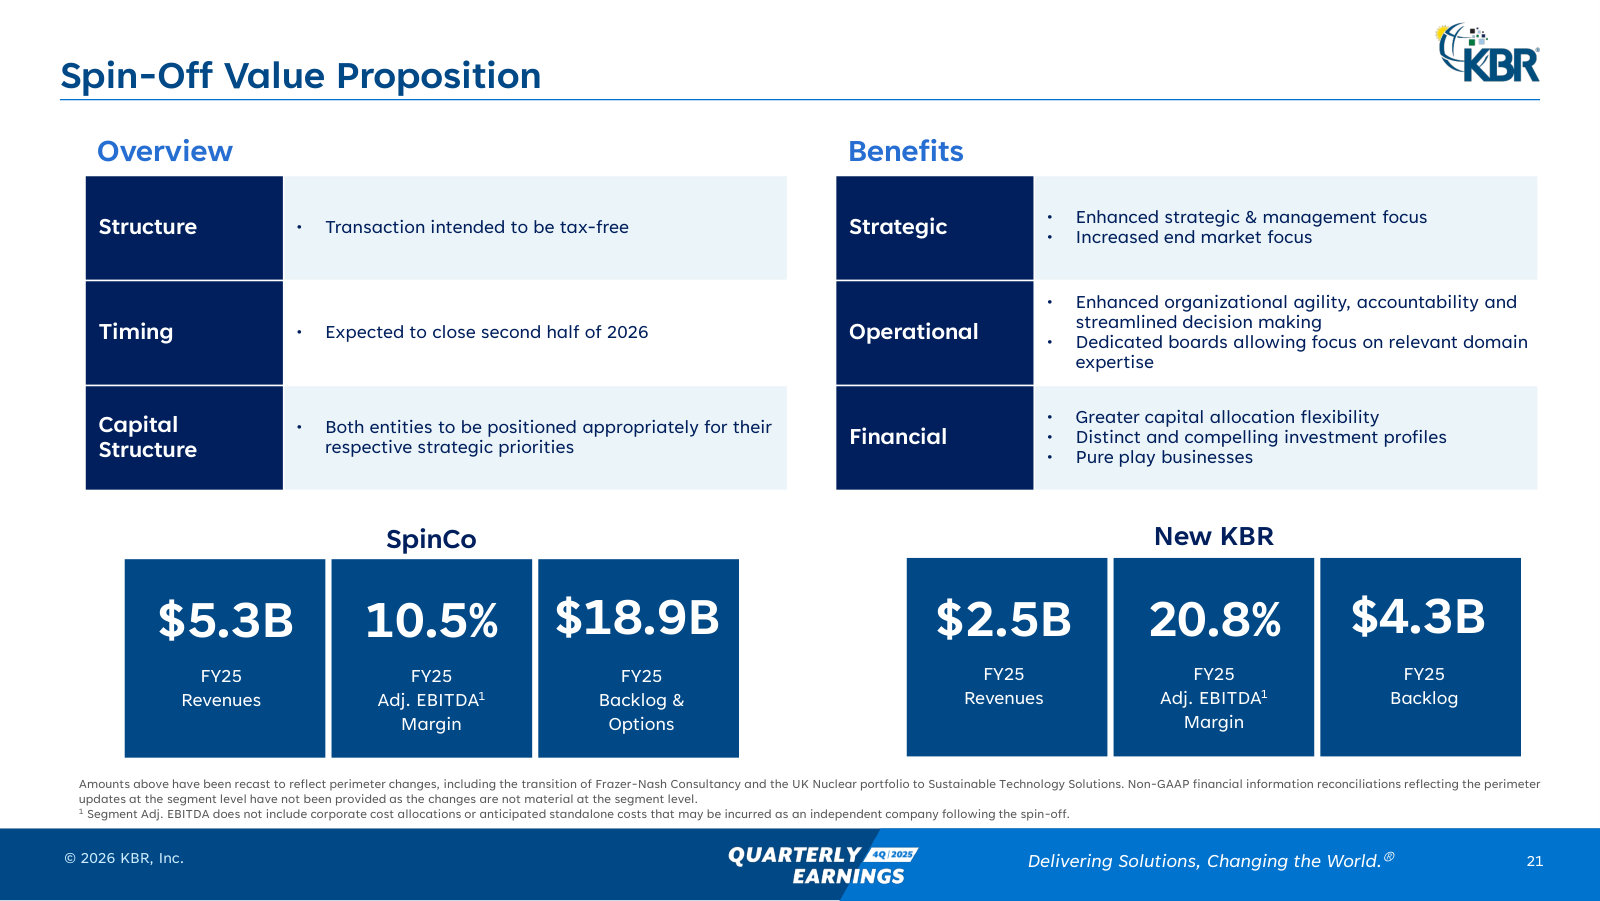
p. 7 — Sustainable Tech's current state — FY25 highlights, FY26 drivers, and KPIs (1.6x book-to-bill, $4.2B backlog, $5B pipeline). · Open the full presentation →p. 8 — Mission Tech's current state — margins up but awards slow; $19.1B backlog, $17B awaiting award, $2.6B in protest. · Open the full presentation →p. 9 — The spin-off timeline — Form 10 filed, tax-free ruling sought, distribution targeted for the second half of 2026. · Open the full presentation →p. 12 — FY25 delivered: $7.79B revenue, $968M EBITDA at 12.4% margin, $3.93 adjusted EPS and 110% cash conversion. · Open the full presentation →p. 15 — Deleveraging back below 2.5x within a year of the LinQuest deal, and a record $413M returned to shareholders in FY25. · Open the full presentation →p. 16 — FY26 guidance with the modeling assumptions — revenue, EBITDA, EPS, cash flow, tax rate, share count and contract coverage. · Open the full presentation →p. 21 — What the two companies look like — SpinCo (Mission Tech, $5.3B, 10.5% margin) and New KBR (Sustainable Tech, $2.5B, 20.8%). · Open the full presentation →
The fullest strategy deep-dive — end-market sizing, segment pipelines and IP economics. Predates the MTS/STS rename; targets since revised. · Open the full document →
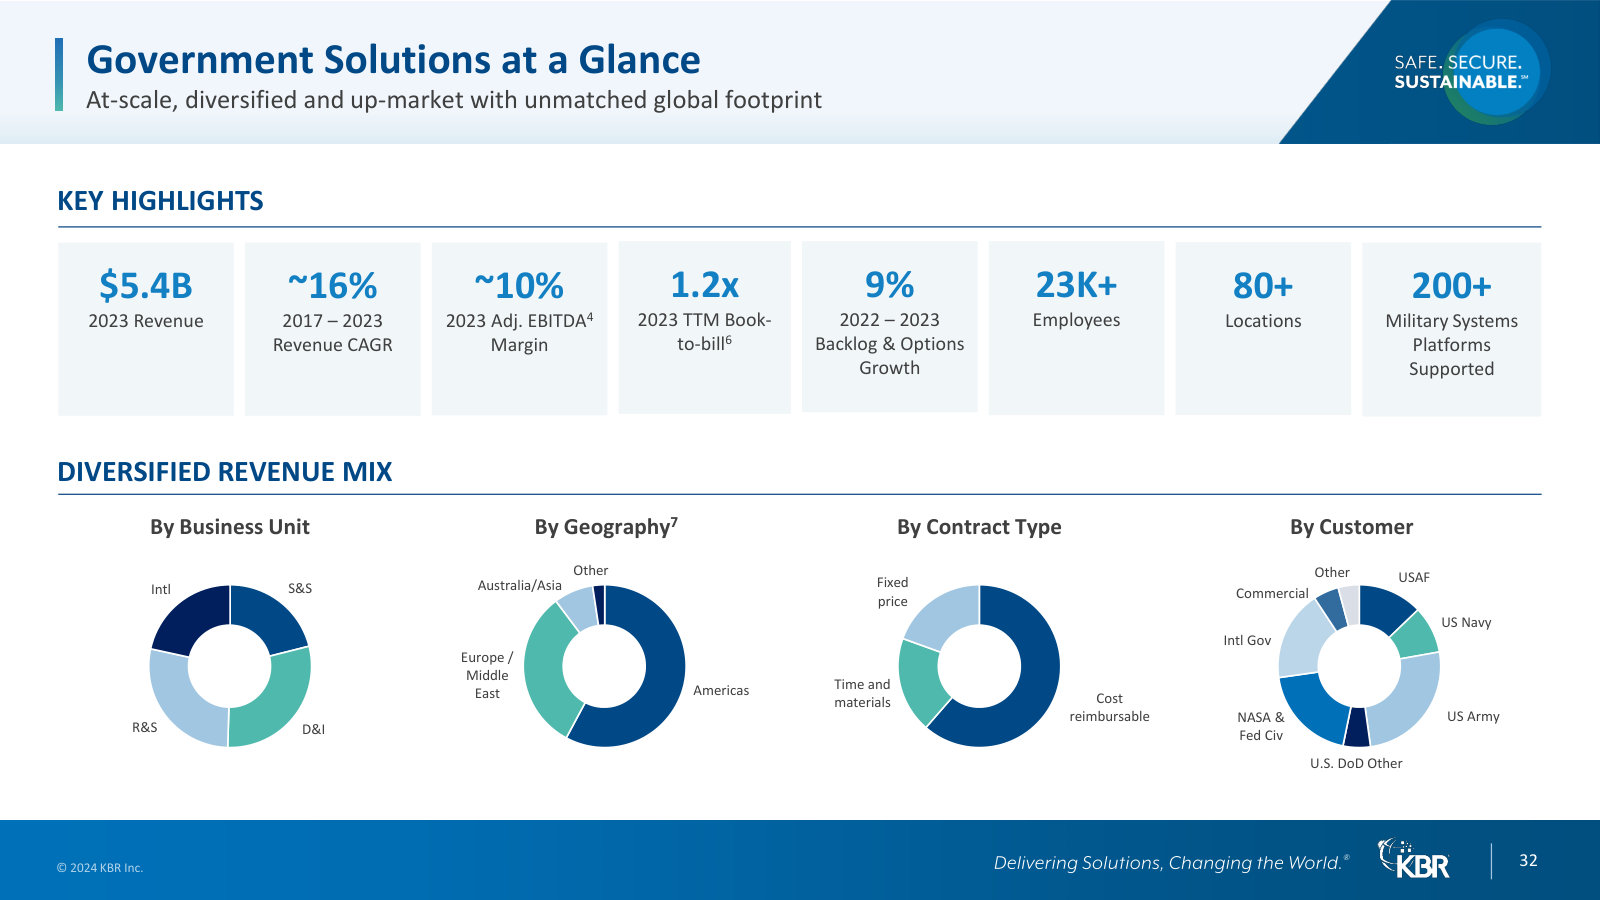
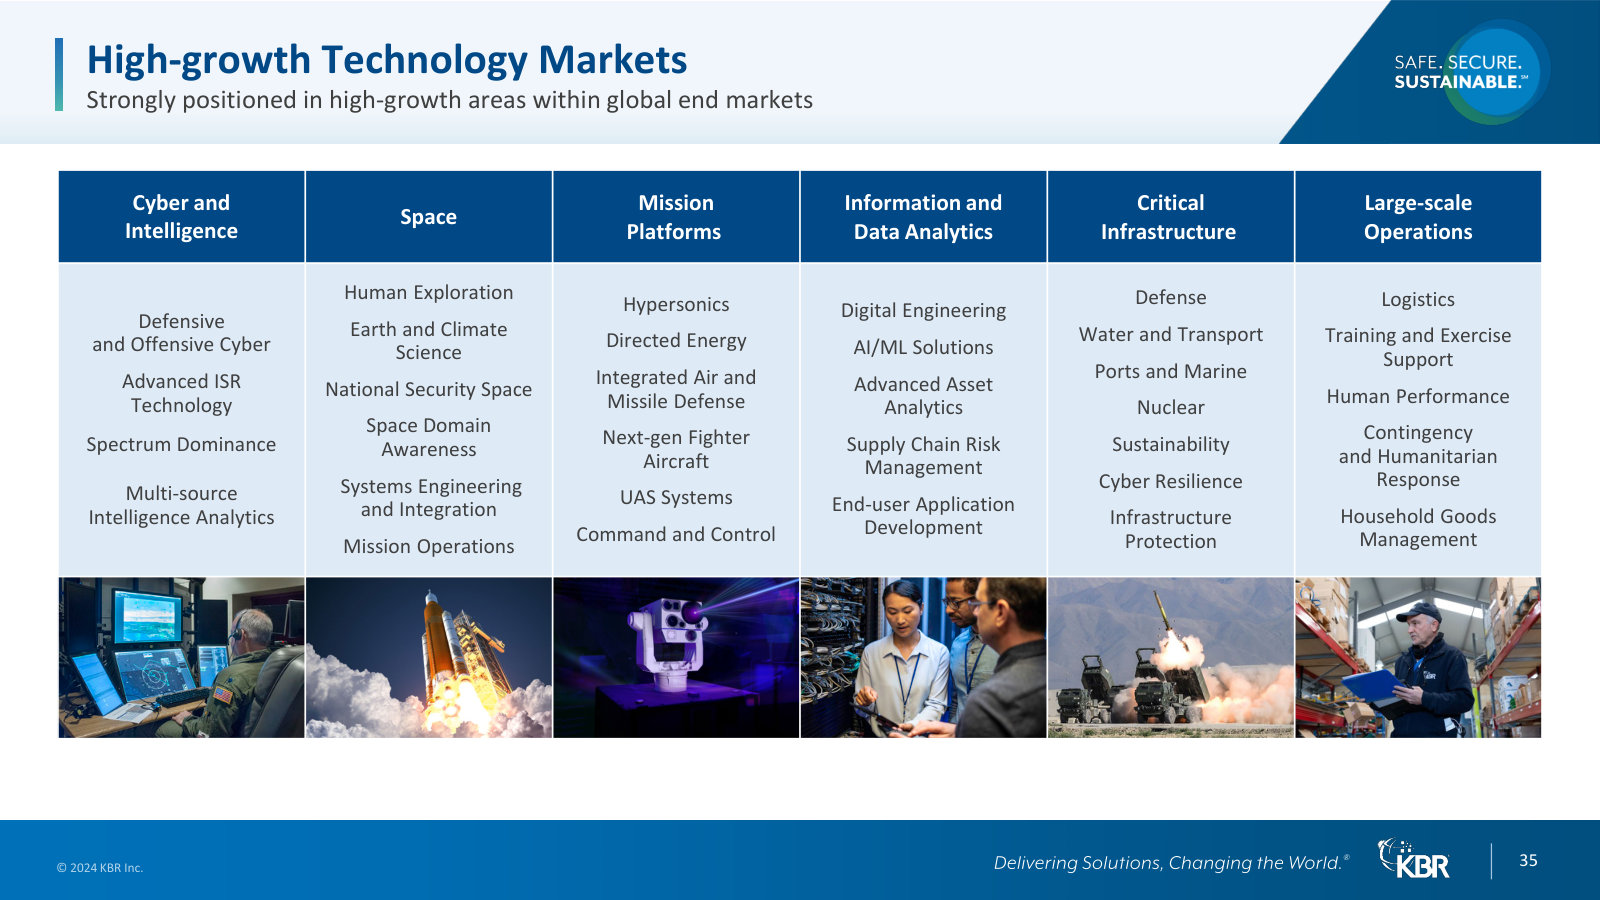
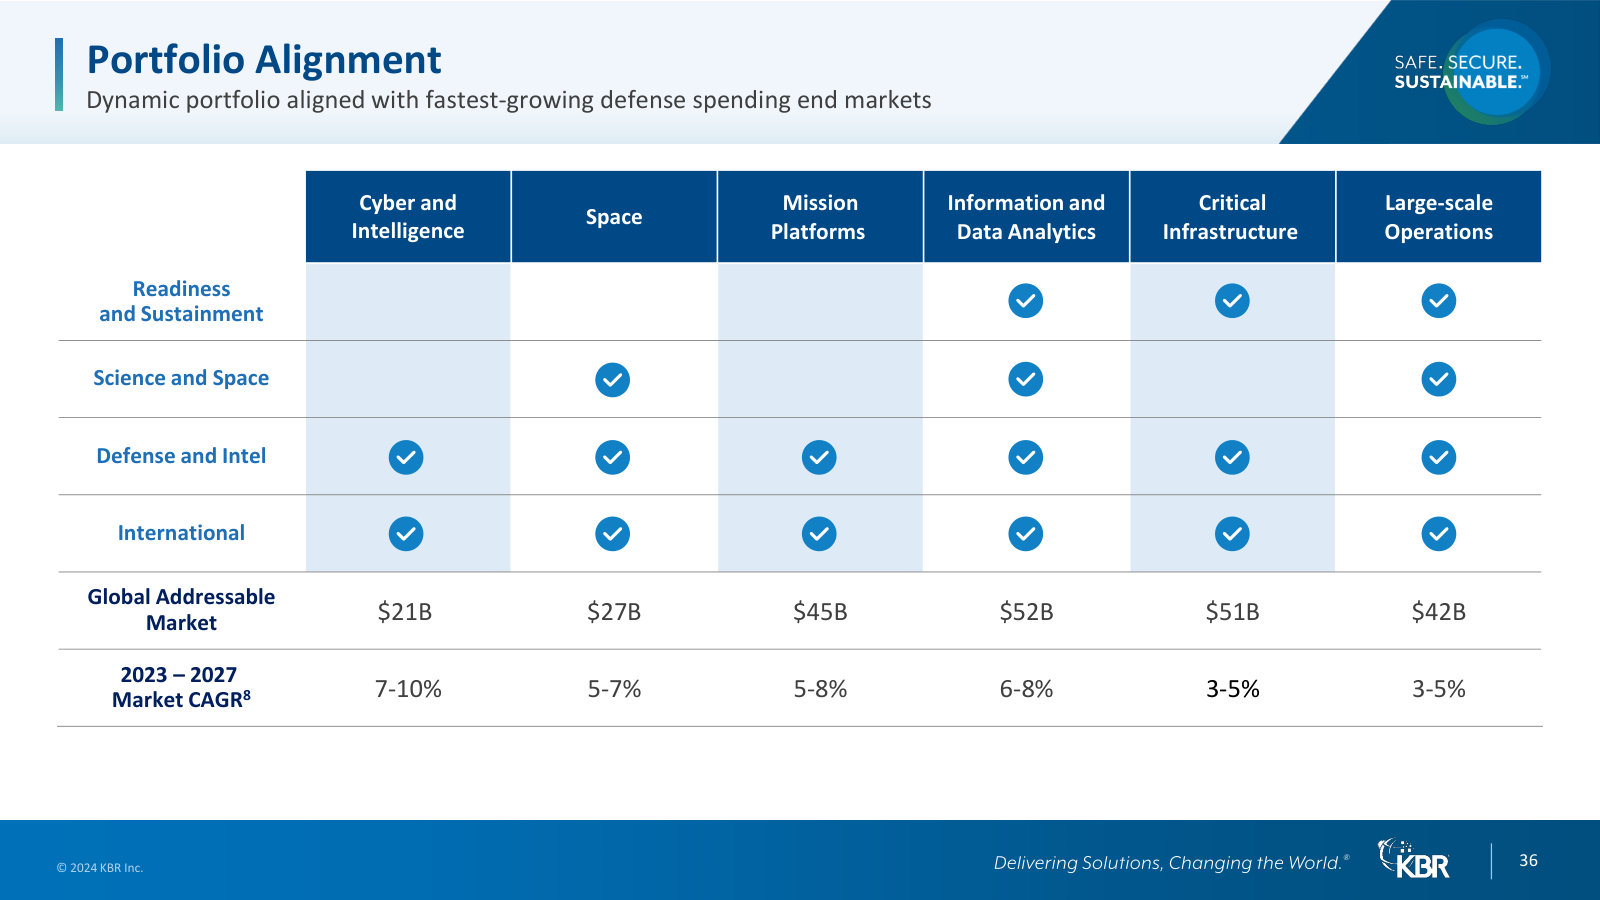
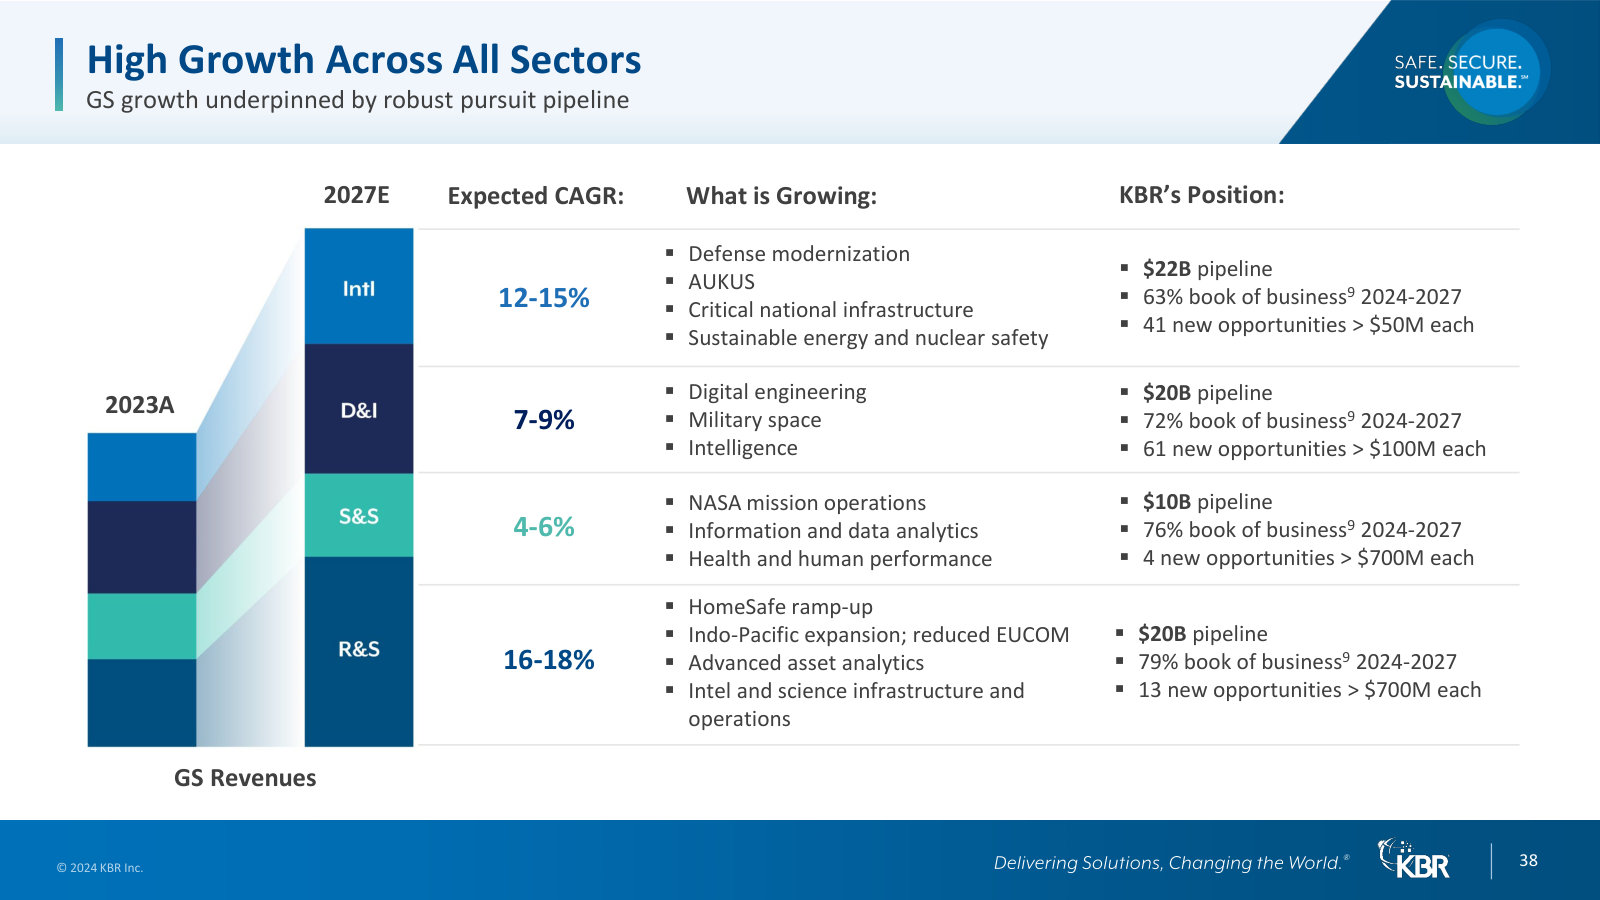
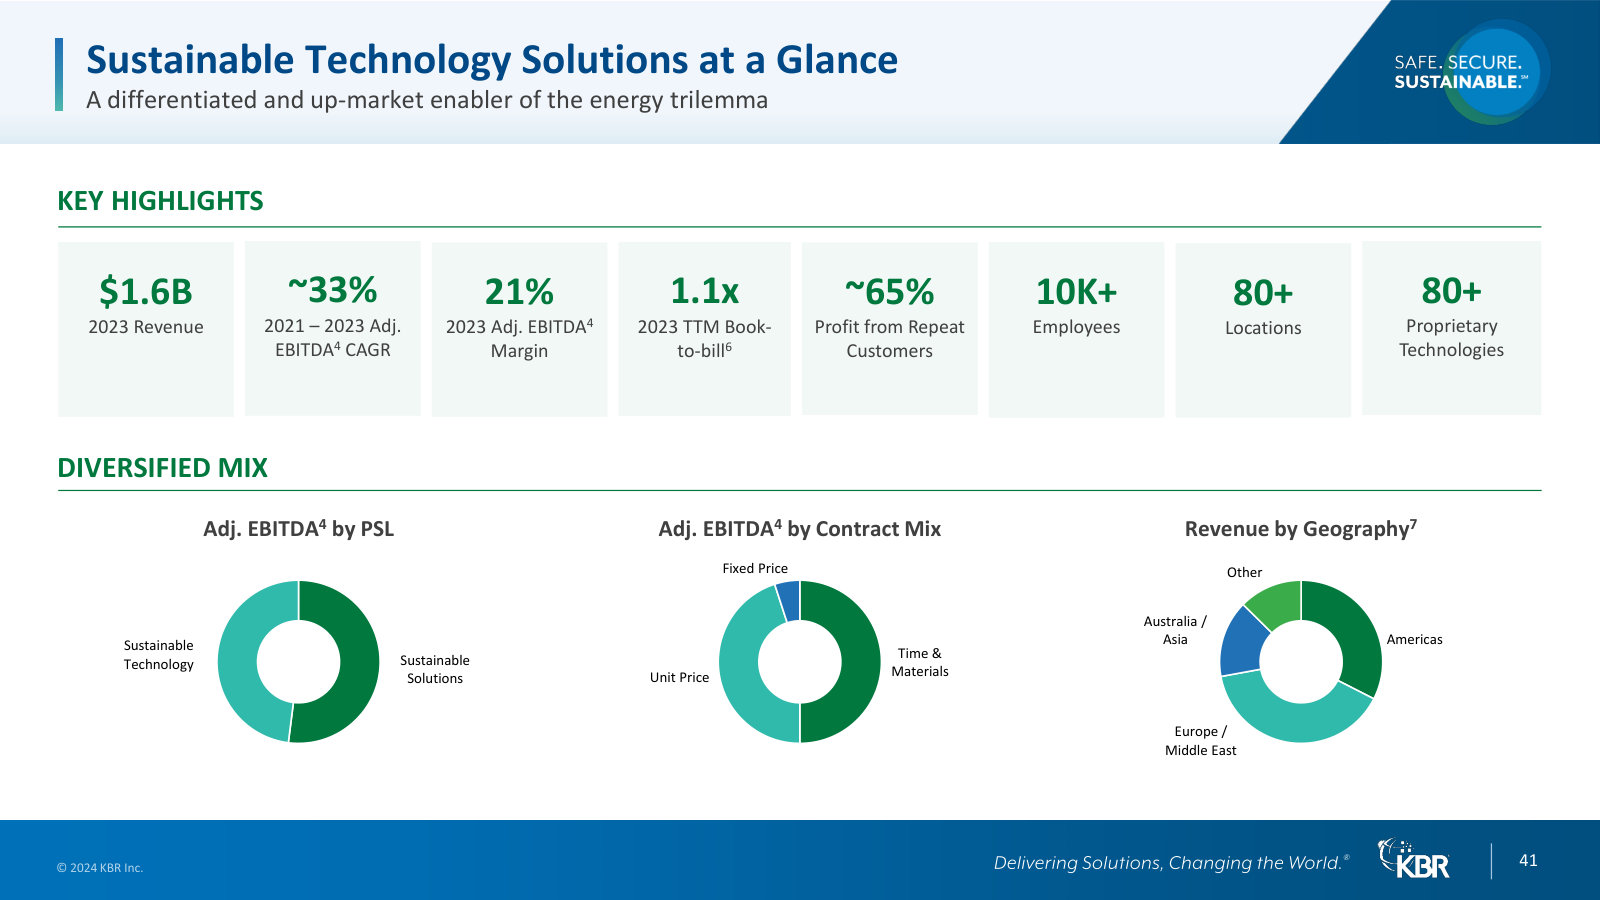
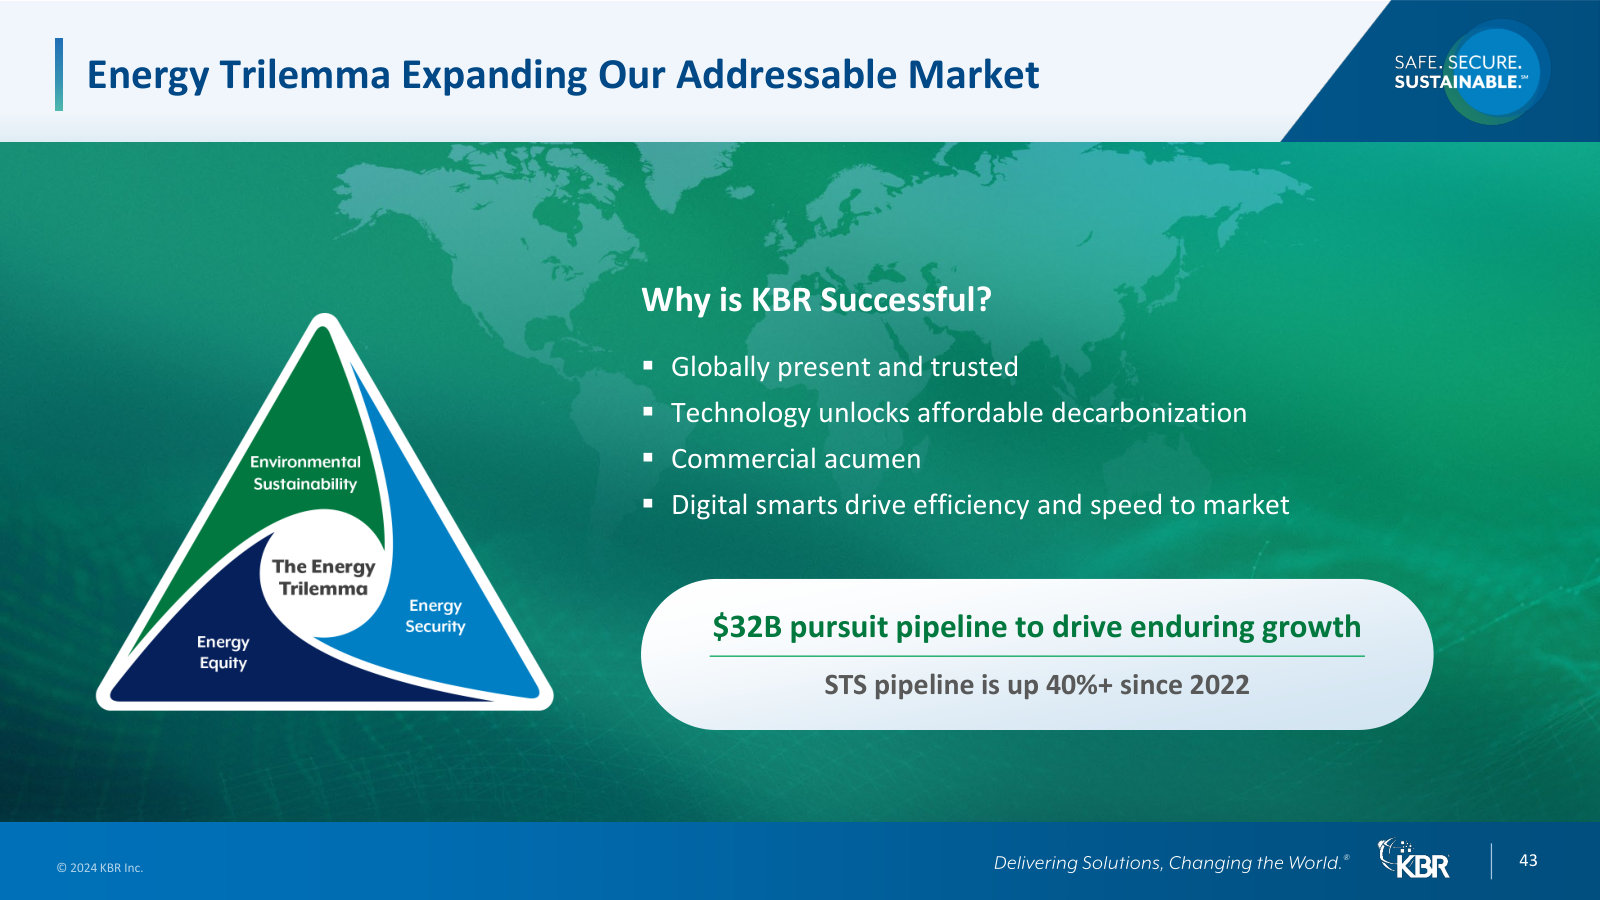
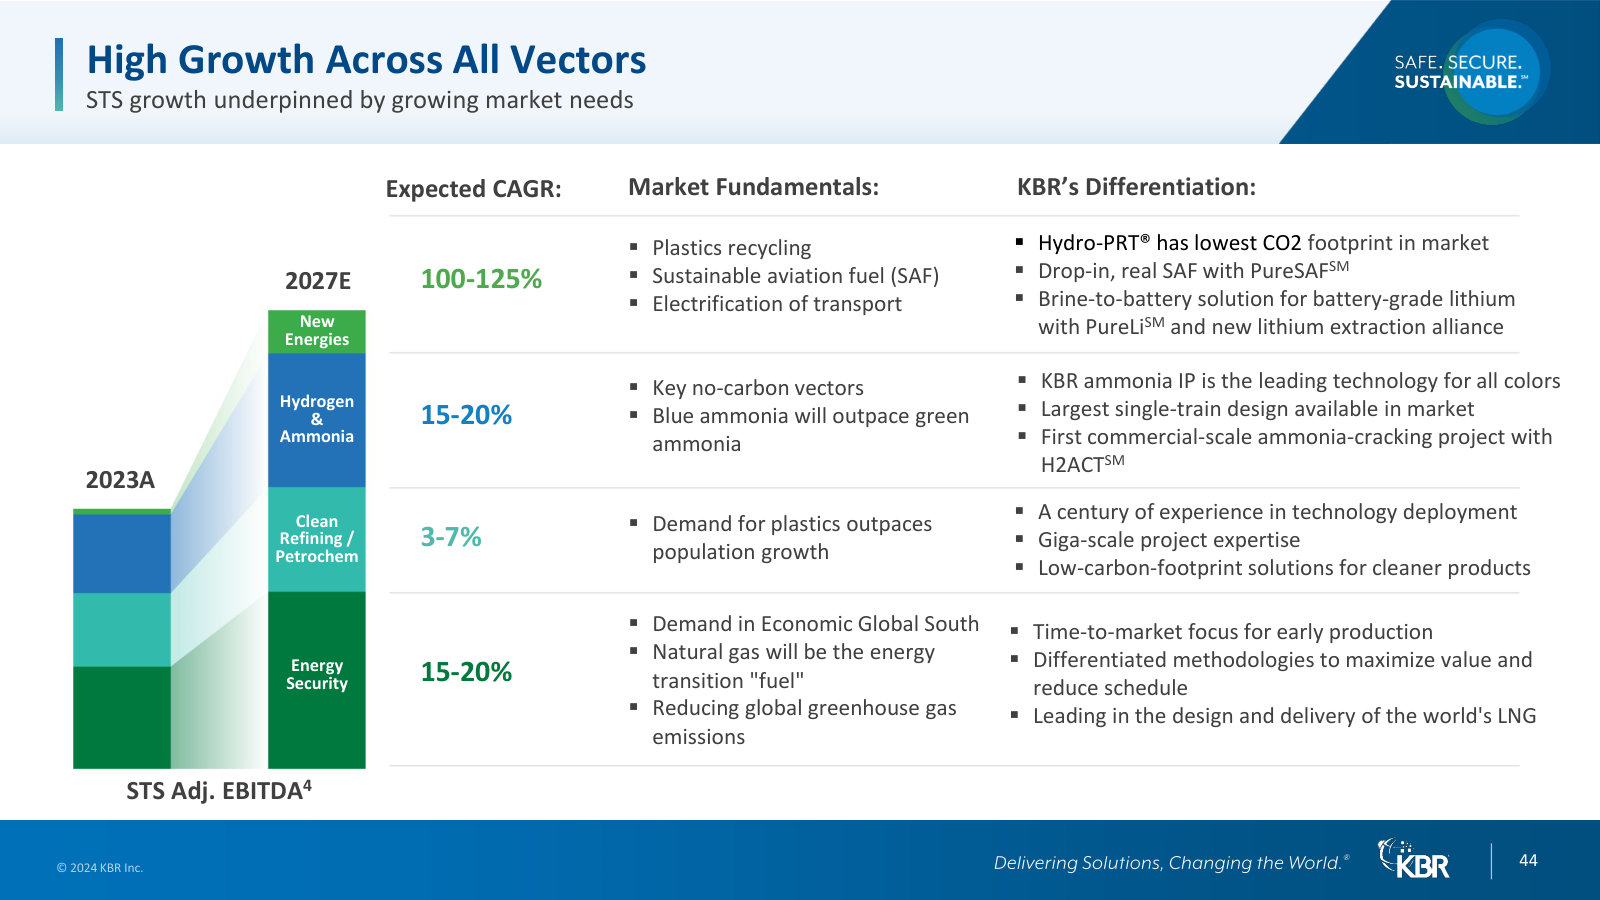
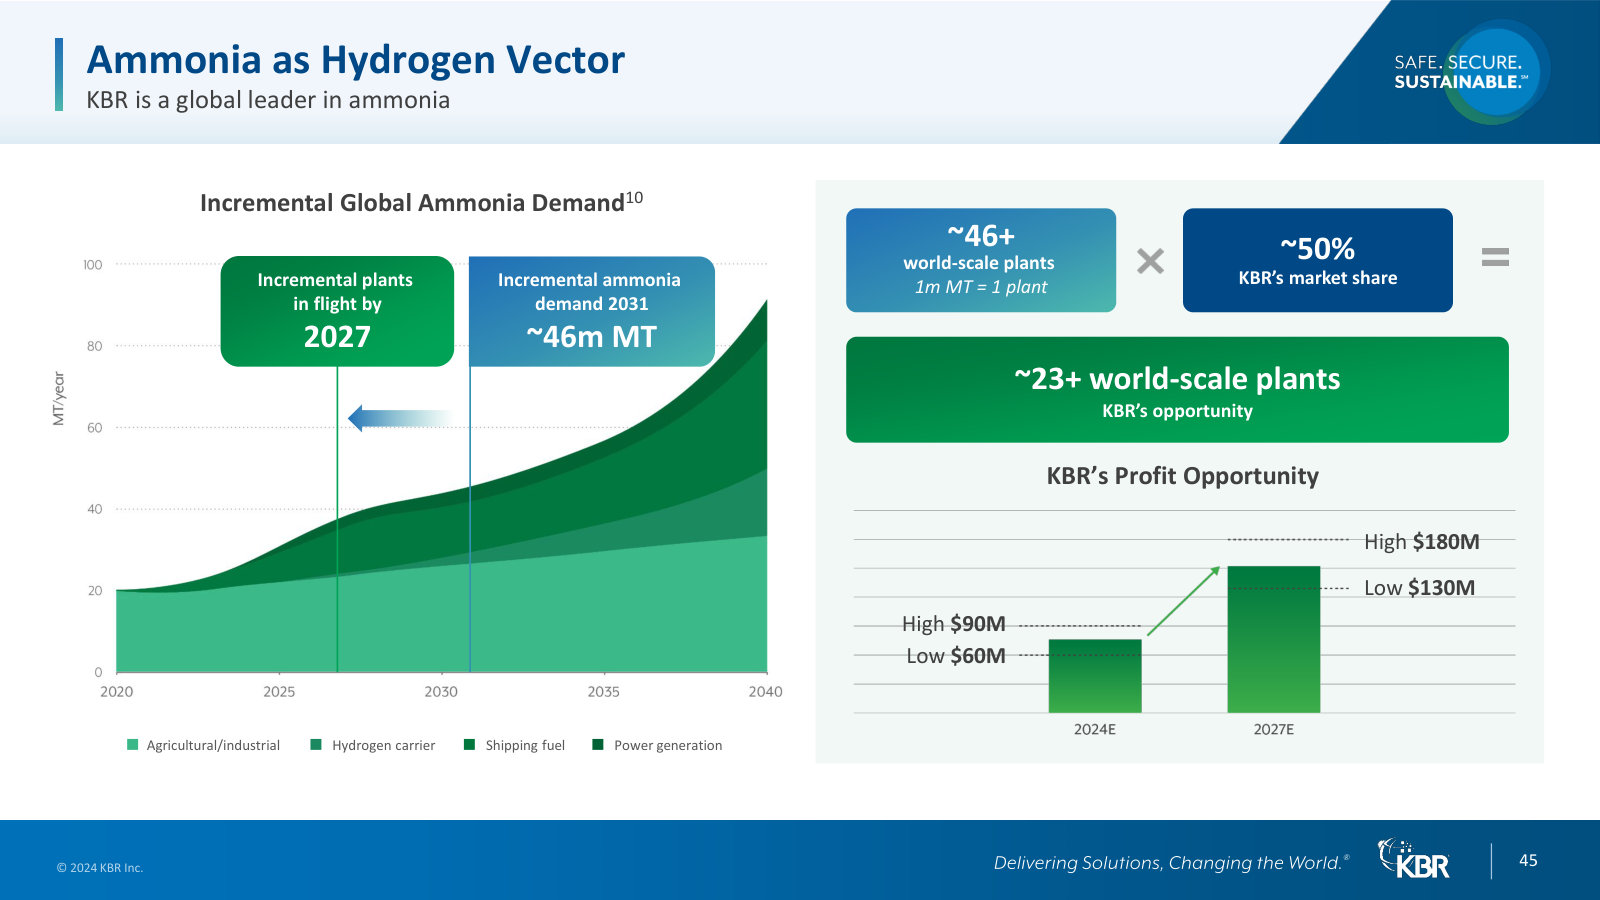
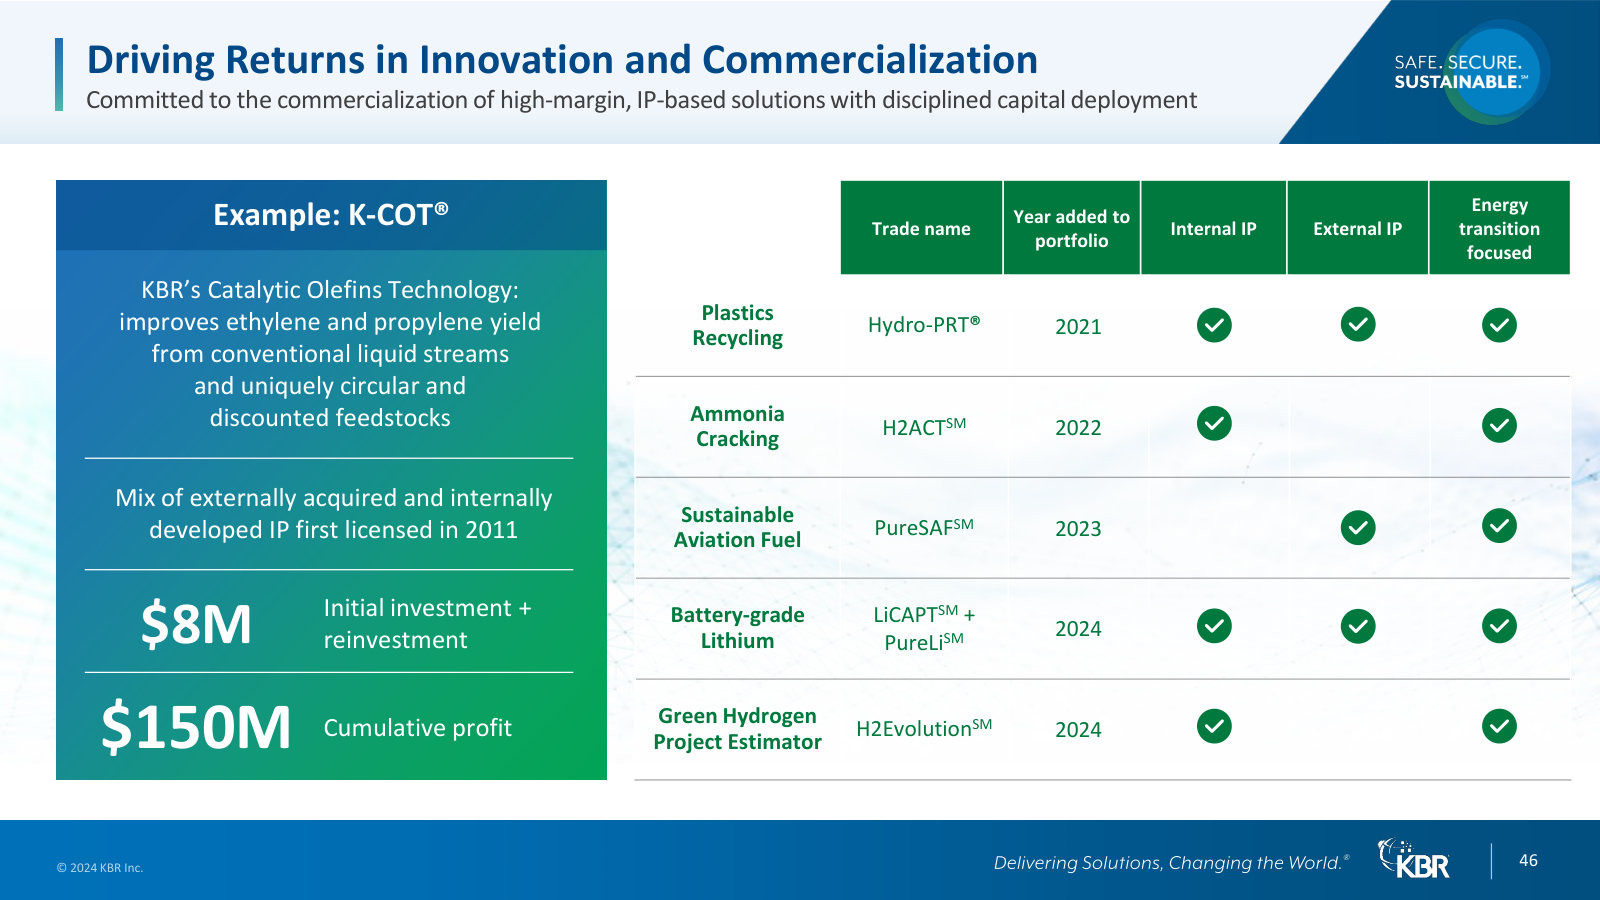
p. 32 — Government segment revenue mix — by business unit, geography, contract type (mostly cost-reimbursable) and customer. · Open the full presentation →p. 35 — The six defense and government technology markets KBR plays in, with the specific capabilities under each. · Open the full presentation →p. 36 — Market sizing: addressable market by end-market ($21B-$52B) and its growth rate, mapped to KBR's business units. · Open the full presentation →p. 38 — Government growth built bottom-up — pipeline dollars, book-of-business coverage and expected CAGR by business unit. · Open the full presentation →p. 41 — Sustainable Tech mix and economics — by product line, contract, geography; 80+ proprietary technologies, 65% repeat business. · Open the full presentation →p. 43 — The 'energy trilemma' framing of the STS market and the $32B pursuit pipeline behind it. · Open the full presentation →p. 44 — STS's growth vectors and the technology that differentiates each — LNG, ammonia, SAF, lithium — with market CAGRs. · Open the full presentation →p. 45 — KBR's flagship position: ~50% share of world-scale ammonia plants, and the profit the coming build-out could add. · Open the full presentation →p. 46 — How KBR monetizes IP — the proprietary technology portfolio and the $8M-in, $150M-cumulative-profit K-COT example. · Open the full presentation →
1Q 2026 Earnings Presentation — 1Q2026 · 27 pages · The latest quarter, and the updated spin-off timeline — separation now expected to close January 4, 2027. · Open →
4Q & Full-Year 2024 Earnings Presentation — 4Q/FY2024 · 27 pages · The prior full-year baseline — FY2024 actuals and guidance, before the spin-off narrative began. · Open →