Full Report
The numbers behind KBR, Inc.: as-reported financial statements and company metrics for FY2021–FY2025, traced to the source filings, opened with the share-price history those statements have to justify. Every linked figure opens the exact page of the filing it was printed on, with the statement row highlighted. Amounts in US$ millions unless noted.
Reading notes: Fiscal-year labels follow KBR's own convention: KBR uses a 52/53-week fiscal year ending on the Friday nearest December 31. FY2025 = year ended January 2, 2026; FY2024 = year ended January 3, 2025 (a 53-week year); FY2023 = year ended December 29, 2023. The corpus filenames and the numeric feed label these one year higher (e.g. the fiscal 2025 10-K is filed as 'KBR_annual_report_FY2026'); the numeric feed also carries a duplicate FY2024 entry equal to the year ended January 3, 2025. FY2023–FY2025 income-statement, cash-flow and backlog figures are presented on a continuing-operations basis after HomeSafe was reclassified to discontinued operations in fiscal 2025 (fiscal 2025 10-K). FY2021–FY2022 include the businesses now in discontinued operations. FY2024 revenue as originally filed was $7,742M (recast to $7,710M). Revenue-by-segment: KBR realigned its reportable segments effective fiscal 2025 — the former 'Government Solutions' segment was renamed 'Mission Technology Solutions' and the international business was redistributed into both segments; all periods in the fiscal 2025 10-K (FY2023–FY2025) were recast. FY2021–FY2022 are shown on the former Government Solutions / Sustainable Technology Solutions basis (International revenue was reported within Government Solutions), so the FY2022→FY2023 change in each segment partly reflects this redistribution rather than organic movement. MTS business-unit detail (Science and Space, Defense and Intel, Readiness and Sustainment) is shown only for the recast FY2023–FY2025 years. FY2021–FY2022 income-statement and per-share figures reflect the full-retrospective adoption of ASU 2020-06 (convertible notes) as presented in the fiscal 2022 10-K; balance-sheet FY2021 is cited from the same 10-K's comparative column.
Share Price — Full Available History — 20 Years
The stock closed at $35.17 on Jul 17, 2026 — up 69% over the window shown (+2.7% a year), trading between $9.86 and $72.02. At that close the stock trades at 11× FY2025 diluted EPS as reported below.
Source: market price feed, monthly closes, sampled from 4,945 source observations, Nov 2006–Jul 2026. Price return only, excludes dividends.
FY2025 at a Glance
Revenue (US$ millions)
Operating income (US$ millions)
Net income (US$ millions)
Diluted EPS
Source: FY2025 consolidated statements [1] [2]. Click any linked figure to open the filing page with the row highlighted.
Revenue by Reportable Segment
| Revenue by Reportable Segment | FY2021 | FY2022 | FY2023 | FY2024 | FY2025 |
|---|---|---|---|---|---|
| Mission Technology Solutions | 6,149 | 5,320 | 5,119 | 5,555 | 5,581 |
| Science and Space | — | — | 1,127 | 1,188 | 1,126 |
| Defense and Intel | — | — | 2,497 | 2,887 | 3,178 |
| Readiness and Sustainment | — | — | 1,495 | 1,480 | 1,277 |
| Sustainable Technology Solutions | 1,190 | 1,244 | 1,837 | 2,155 | 2,205 |
| Total revenues | 7,339 | 6,564 | 6,956 | 7,710 | 7,786 |
| Total revenues growth, derived | — | -10.6% | +6.0% | +10.8% | +1.0% |
Source: Form 10-K MD&A Results of Operations by Business Segment; Note 3 Revenue disaggregation (business-unit detail, recast FY2023–FY2025) [3] [4] [5]. Click any linked figure to open the filing page with the row highlighted.
Operating Income by Segment
| Operating Income by Segment | FY2021 | FY2022 | FY2023 | FY2024 | FY2025 |
|---|---|---|---|---|---|
| Mission Technology Solutions | 414 | 441 | 256 | 415 | 463 |
| Sustainable Technology Solutions | (30) | 47 | 354 | 405 | 477 |
| Corporate | (153) | (145) | (161) | (161) | (162) |
| Total operating income | 231 | 343 | 449 | 659 | 778 |
Source: Form 10-K MD&A Results of Operations by Business Segment [4] [5]. Click any linked figure to open the filing page with the row highlighted.
Income Statement
Source: Consolidated Statements of Operations [1] [2]. Click any linked figure to open the filing page with the row highlighted.
Columns marked E are consensus analyst estimates shown alongside reported results for direct comparison; they are not company guidance.
Estimate source: Yahoo Finance analyst consensus, as of 2026-07-17. Estimate figures link to the consensus source, not to filing pages.
Balance Sheet
Source: Consolidated Balance Sheets [6] [7] [8]. Click any linked figure to open the filing page with the row highlighted.
Cash Flow
Source: Consolidated Statements of Cash Flows (FY2023–FY2025 operating activities on a continuing-operations basis) [9] [10] [11]. Click any linked figure to open the filing page with the row highlighted.
Order Book Backlog
| Order Book Backlog | FY2021 | FY2022 | FY2023 | FY2024 | FY2025 |
|---|---|---|---|---|---|
| Total backlog | 14,973 | 15,555 | 17,335 | 17,264 | 16,864 |
| Mission Technology Solutions backlog | 12,628 | 11,543 | 12,790 | 13,554 | 12,712 |
| Sustainable Technology Solutions backlog | 2,345 | 4,012 | 4,545 | 3,710 | 4,152 |
| Backlog and options | — | — | 21,732 | 21,239 | 23,211 |
| Book-to-bill (trailing twelve months) | — | 1.2 | 1.1 | 1.1 | — |
Source: company filings [12] [13] [14] [15]. Click any linked figure to open the filing page with the row highlighted.
Non-GAAP Profitability Leverage
| Non-GAAP Profitability Leverage | FY2021 | FY2022 | FY2023 | FY2024 | FY2025 |
|---|---|---|---|---|---|
| Adjusted EBITDA | 625 | 668 | 747 | 870 | 968 |
| Adjusted EBITDA margin | — | 10.2% | 10.7% | 11.2% | 12.4% |
| Adjusted EPS | 2.43 | 2.71 | 2.91 | 3.34 | 3.93 |
| Net leverage (net debt / adjusted EBITDA) | — | — | 2.1 | 2.6 | 2.2 |
Source: company filings [16] [14] [17] [18]. Click any linked figure to open the filing page with the row highlighted.
Segment Margins Scale
| Segment Margins Scale | FY2021 | FY2022 | FY2023 | FY2024 | FY2025 |
|---|---|---|---|---|---|
| Mission Technology Solutions adjusted EBITDA margin | — | — | 10.0% | 9.8% | 10.4% |
| Sustainable Technology Solutions adjusted EBITDA margin | — | — | 21.0% | 20.4% | 22.5% |
| Employees (KBR) | — | 30,000 | 34,000 | 38,000 | 36,000 |
| U.S. government revenue concentration | — | 61.0% | 58.0% | 57.0% | 57.0% |
Source: company filings [12] [13] [19] [20]. Click any linked figure to open the filing page with the row highlighted.
Long-Term Record
| Fiscal year | Total revenue | Operating income | Net income (loss) attributable to KBR | Diluted earnings (loss) per share | Total cash flows provided by operating activities |
|---|---|---|---|---|---|
| FY2017 | 4,171 | 264 | 432 | 3.05 | 193 |
| FY2018 | 4,913 | 468 | 281 | 1.99 | 165 |
| FY2019 | 5,639 | 362 | 202 | 1.41 | 256 |
| FY2020 | 5,767 | 57 | (63) | (0.44) | 367 |
| FY2021 | 7,339 | 231 | 27 | 0.19 | 278 |
| FY2022 | 6,564 | 343 | 190 | 1.26 | 396 |
| FY2023 | 6,956 | 449 | (265) | (1.96) | 301 |
| FY2024 | 7,710 | 659 | 375 | 2.79 | 450 |
| FY2025 | 7,786 | 778 | 415 | 3.21 | 557 |
Source: consolidated statements across filings; older years from the standardized feed [9] [1] [11] [2]. Click any linked figure to open the filing page with the row highlighted.
Operating KPIs
| KPI | FY2021 | FY2022 | FY2023 | FY2024 | FY2025 |
|---|---|---|---|---|---|
| Total backlog | 14,973 | 15,555 | 17,335 | 16,605 | 16,864 |
Source: company-reported operating metrics [21] [22] [23]. Click any linked figure to open the filing page with the row highlighted.
Analyst Consensus
Current price
Mean target
Median target
High target
Low target
Estimate source: Yahoo Finance analyst consensus, as of 2026-07-17. Estimate figures link to the consensus source, not to filing pages.
Traceability
322 of 342 figures on this page (94%) link to the filing page where they are printed — click a linked figure to open the source PDF at that page with the row highlighted. Unlinked figures come from standardized data feeds or pre-filing years.
Fiscal-year labels follow KBR's own convention: KBR uses a 52/53-week fiscal year ending on the Friday nearest December 31. FY2025 = year ended January 2, 2026; FY2024 = year ended January 3, 2025 (a 53-week year); FY2023 = year ended December 29, 2023. The corpus filenames and the numeric feed label these one year higher (e.g. the fiscal 2025 10-K is filed as 'KBR_annual_report_FY2026'); the numeric feed also carries a duplicate FY2024 entry equal to the year ended January 3, 2025.
FY2023–FY2025 income-statement, cash-flow and backlog figures are presented on a continuing-operations basis after HomeSafe was reclassified to discontinued operations in fiscal 2025 (fiscal 2025 10-K). FY2021–FY2022 include the businesses now in discontinued operations. FY2024 revenue as originally filed was $7,742M (recast to $7,710M).
Revenue-by-segment: KBR realigned its reportable segments effective fiscal 2025 — the former 'Government Solutions' segment was renamed 'Mission Technology Solutions' and the international business was redistributed into both segments; all periods in the fiscal 2025 10-K (FY2023–FY2025) were recast. FY2021–FY2022 are shown on the former Government Solutions / Sustainable Technology Solutions basis (International revenue was reported within Government Solutions), so the FY2022→FY2023 change in each segment partly reflects this redistribution rather than organic movement. MTS business-unit detail (Science and Space, Defense and Intel, Readiness and Sustainment) is shown only for the recast FY2023–FY2025 years.
FY2021–FY2022 income-statement and per-share figures reflect the full-retrospective adoption of ASU 2020-06 (convertible notes) as presented in the fiscal 2022 10-K; balance-sheet FY2021 is cited from the same 10-K's comparative column.
Total backlog for FY2024–FY2025 excludes HomeSafe (discontinued operations); FY2021–FY2023 backlog includes it.
FY2017–FY2020 long-term-record figures are from the standardized SEC XBRL data feed and are shown without page links.
3 figure(s) differed between the data feed and the filing; the filing value is shown (see the run's metrics/metrics_tab.json for the audit trail).
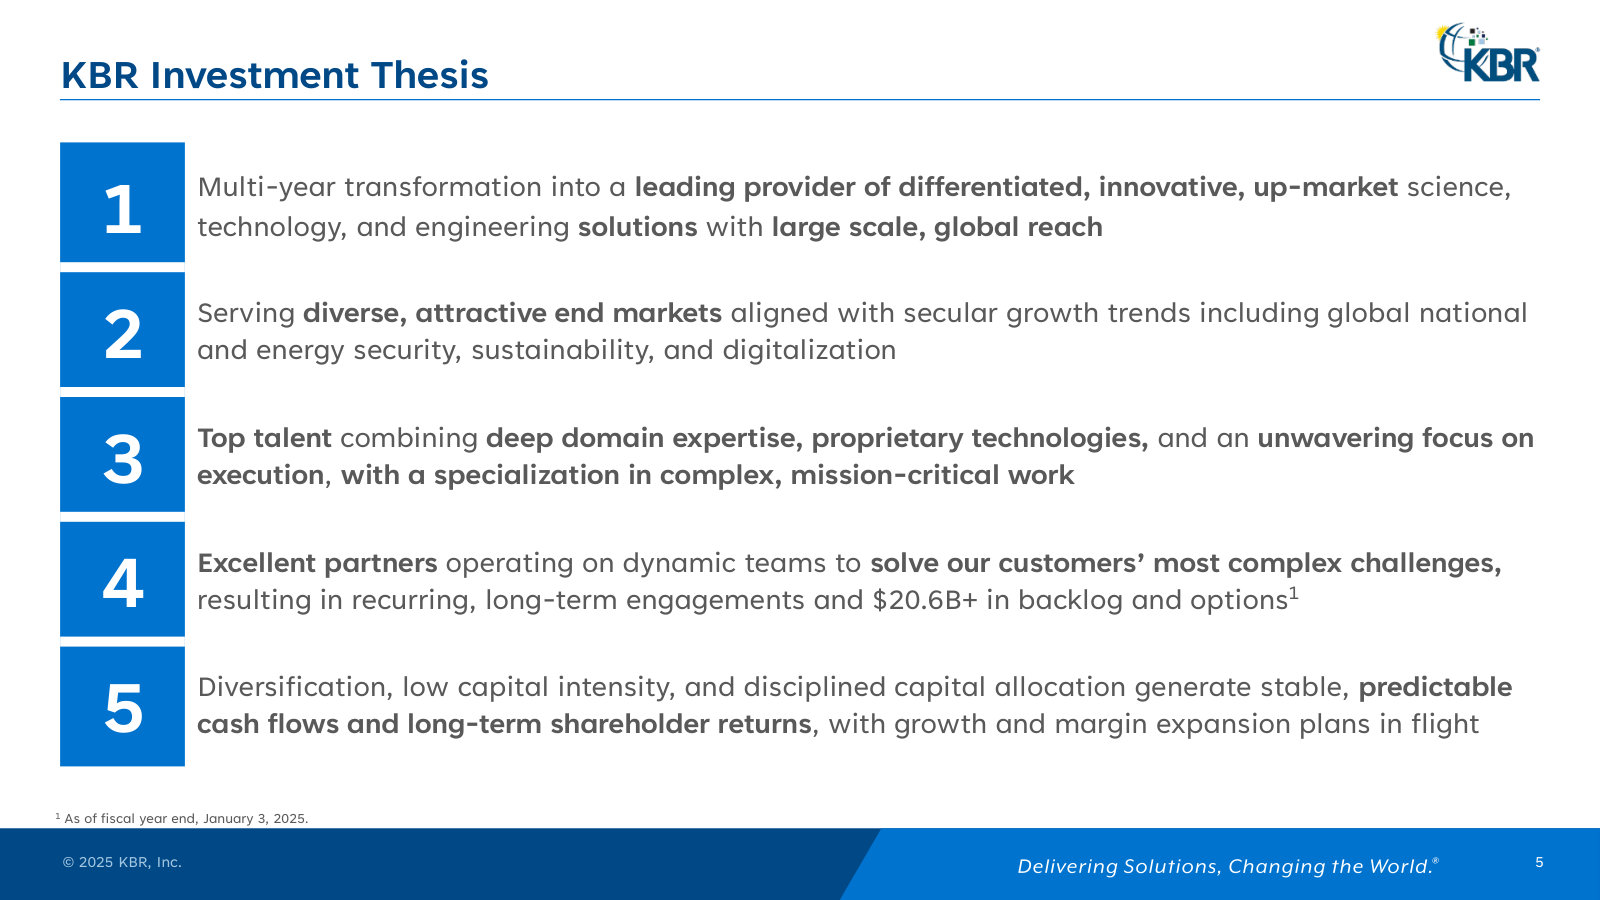
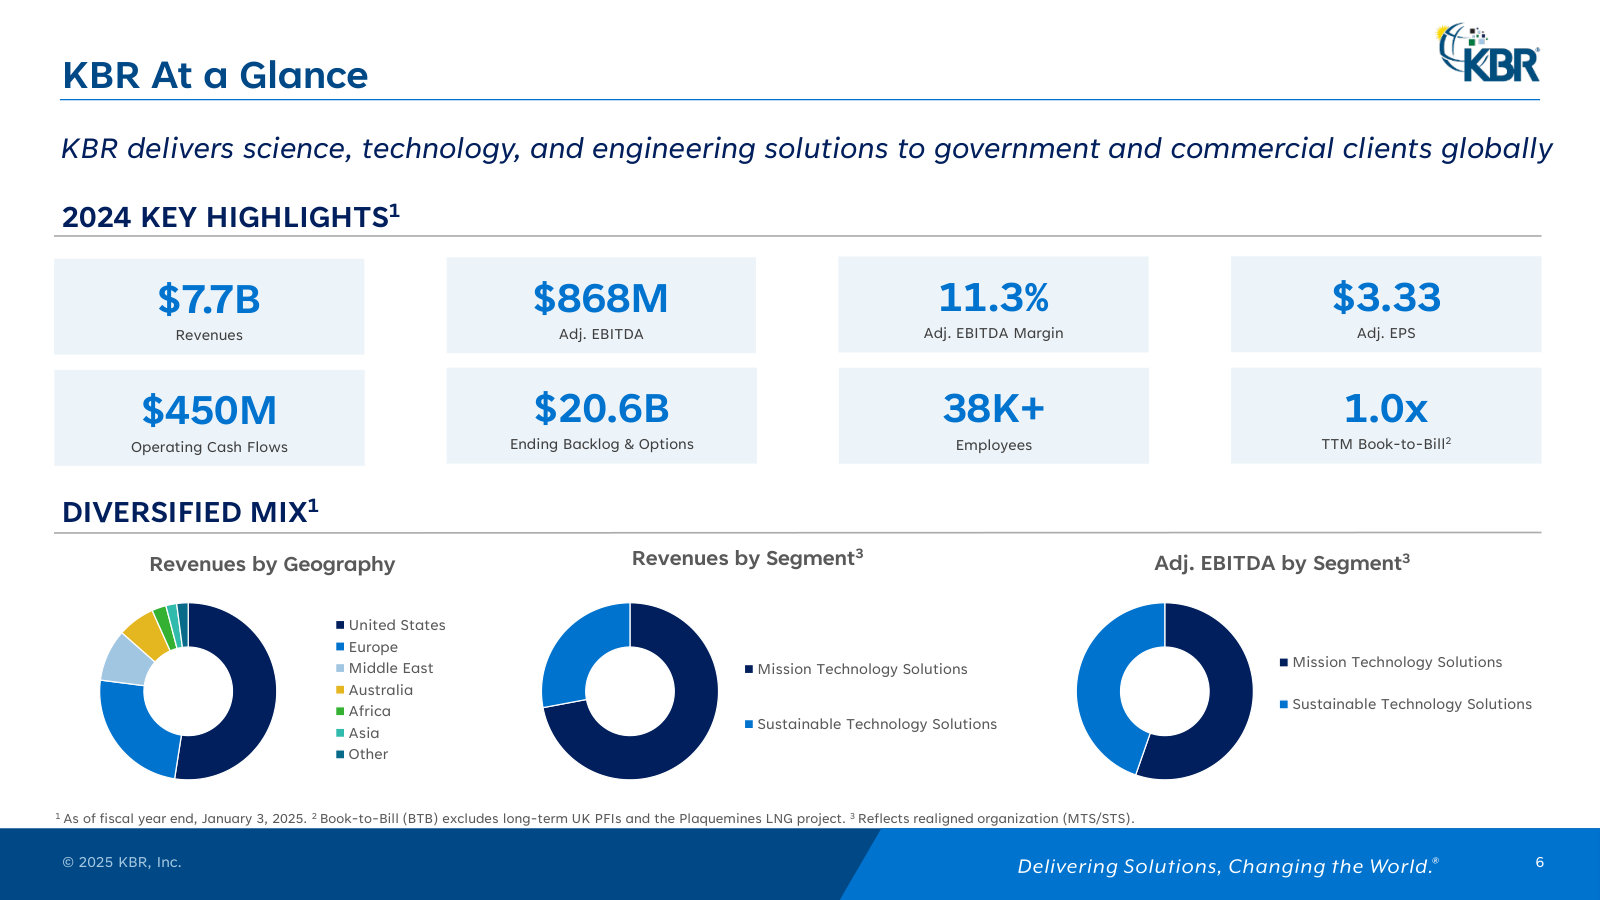
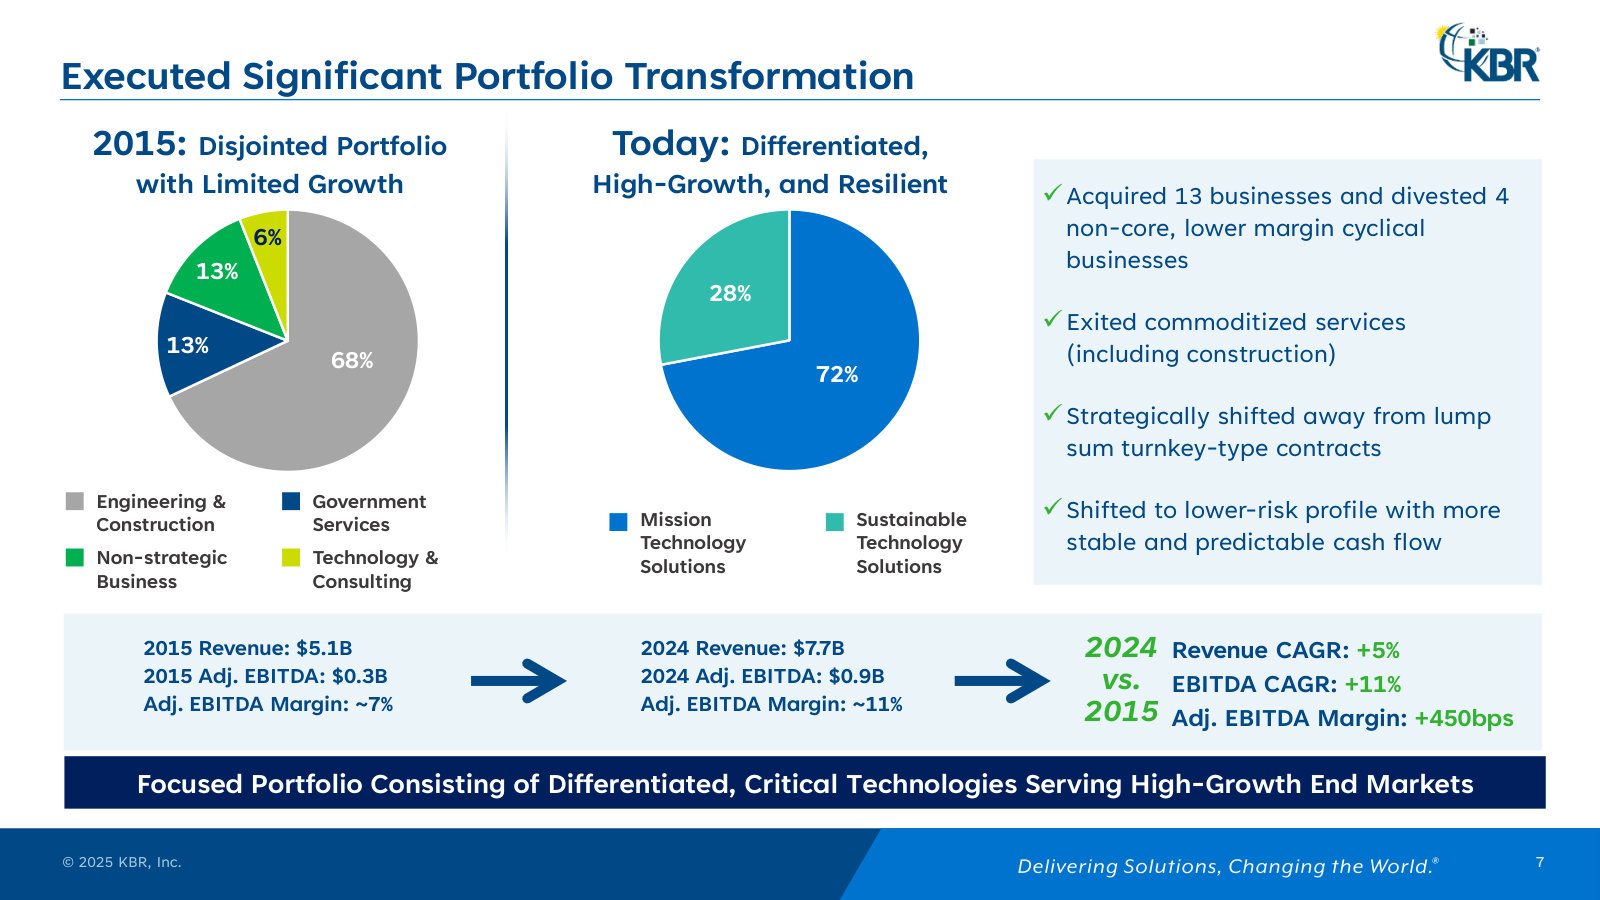
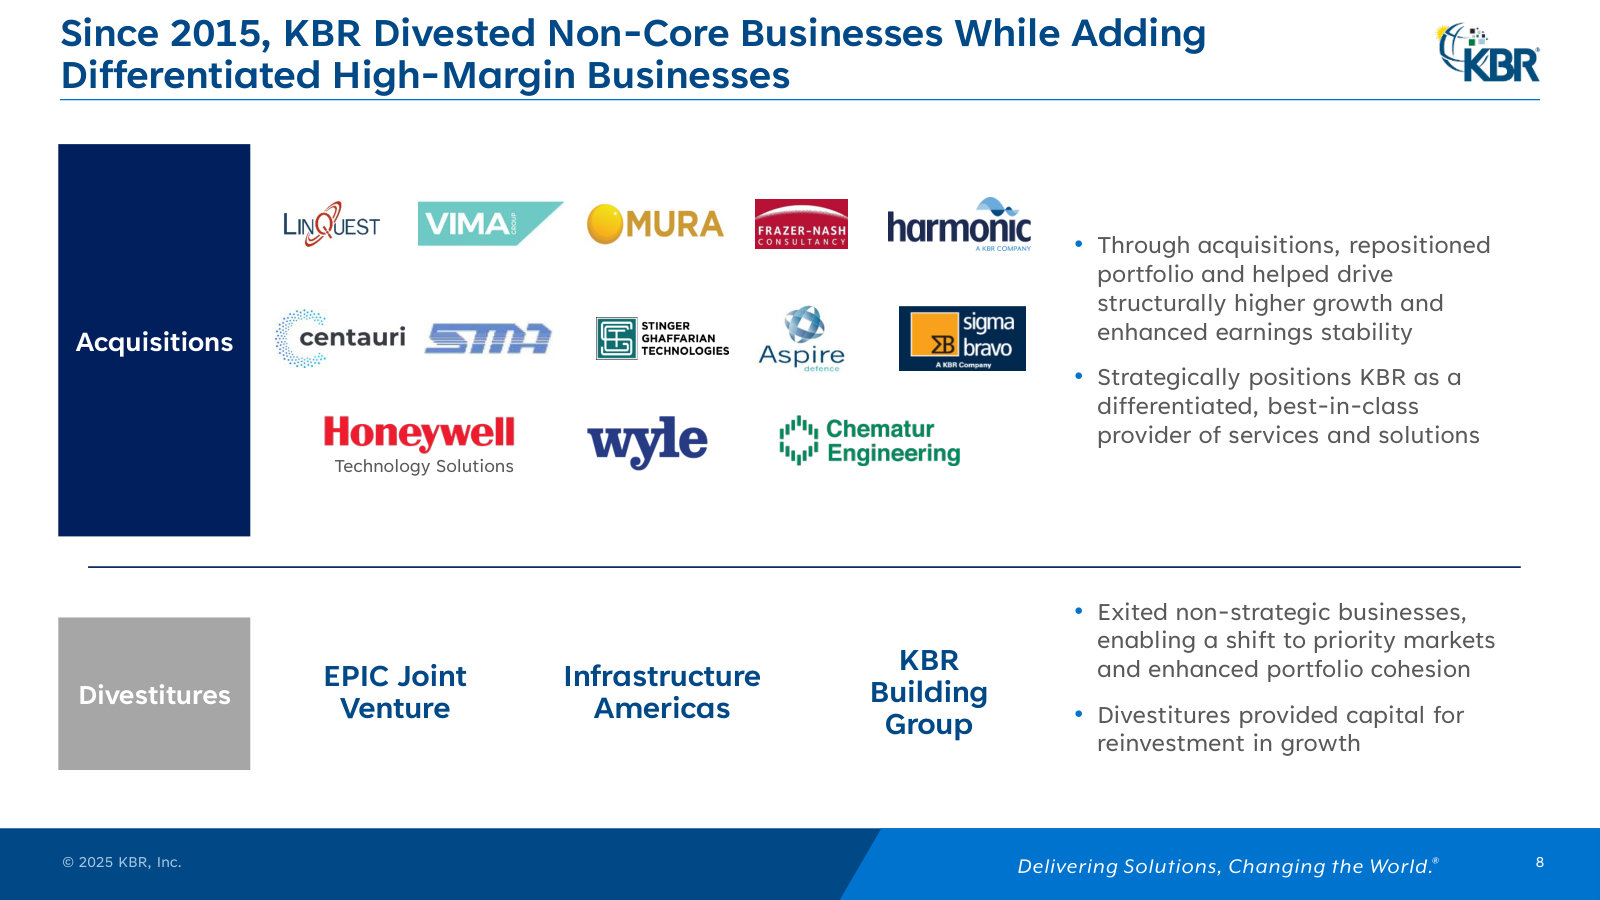
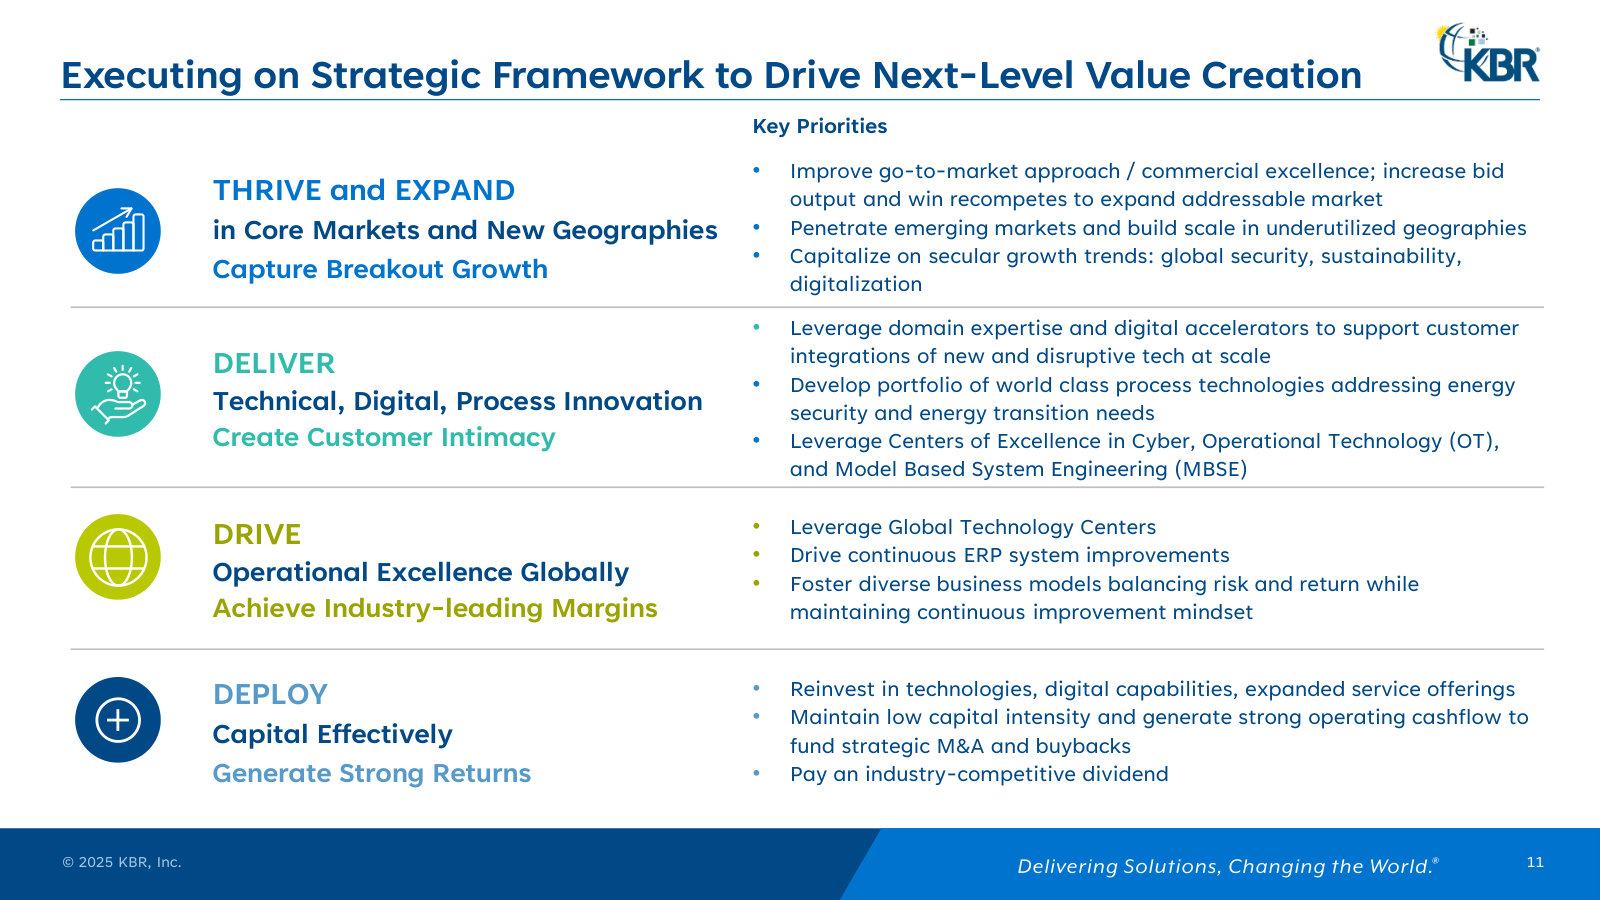
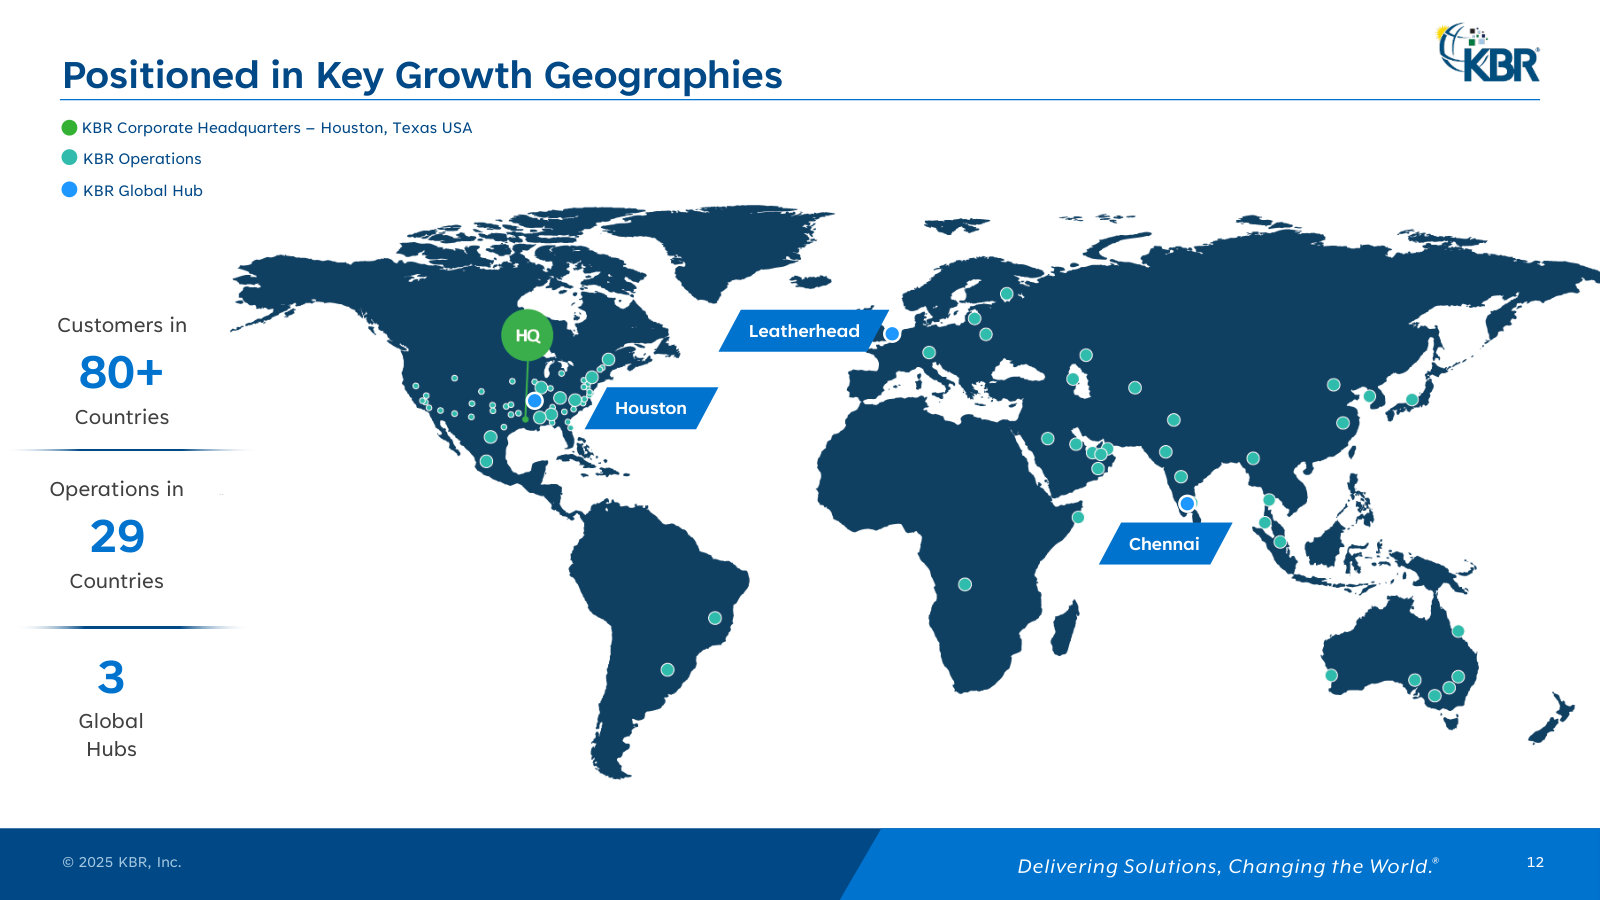
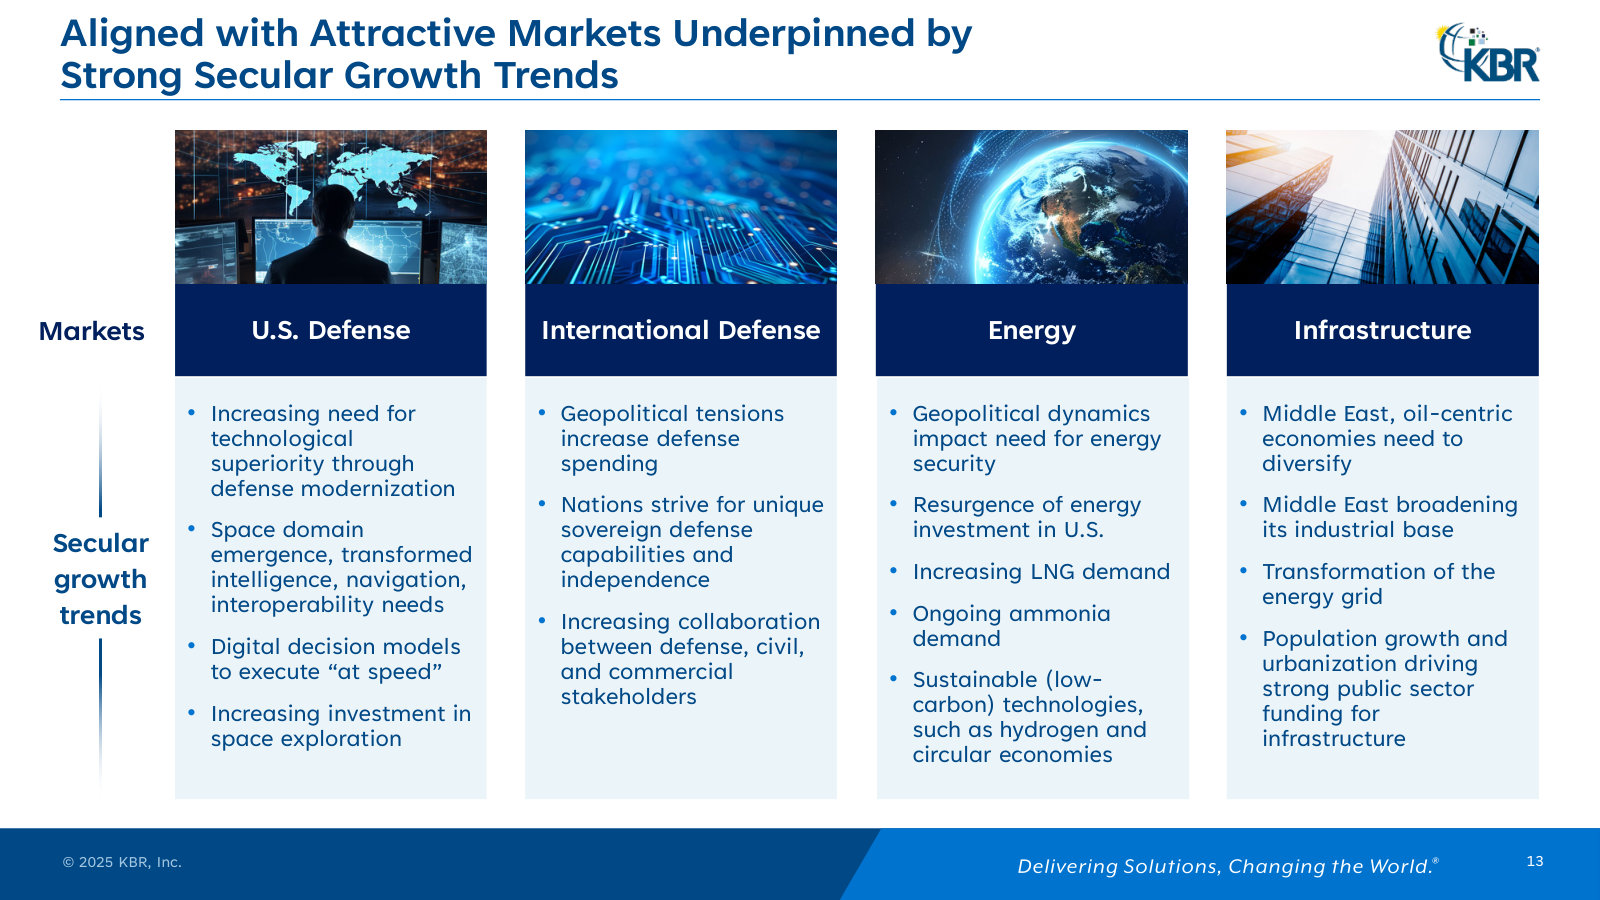
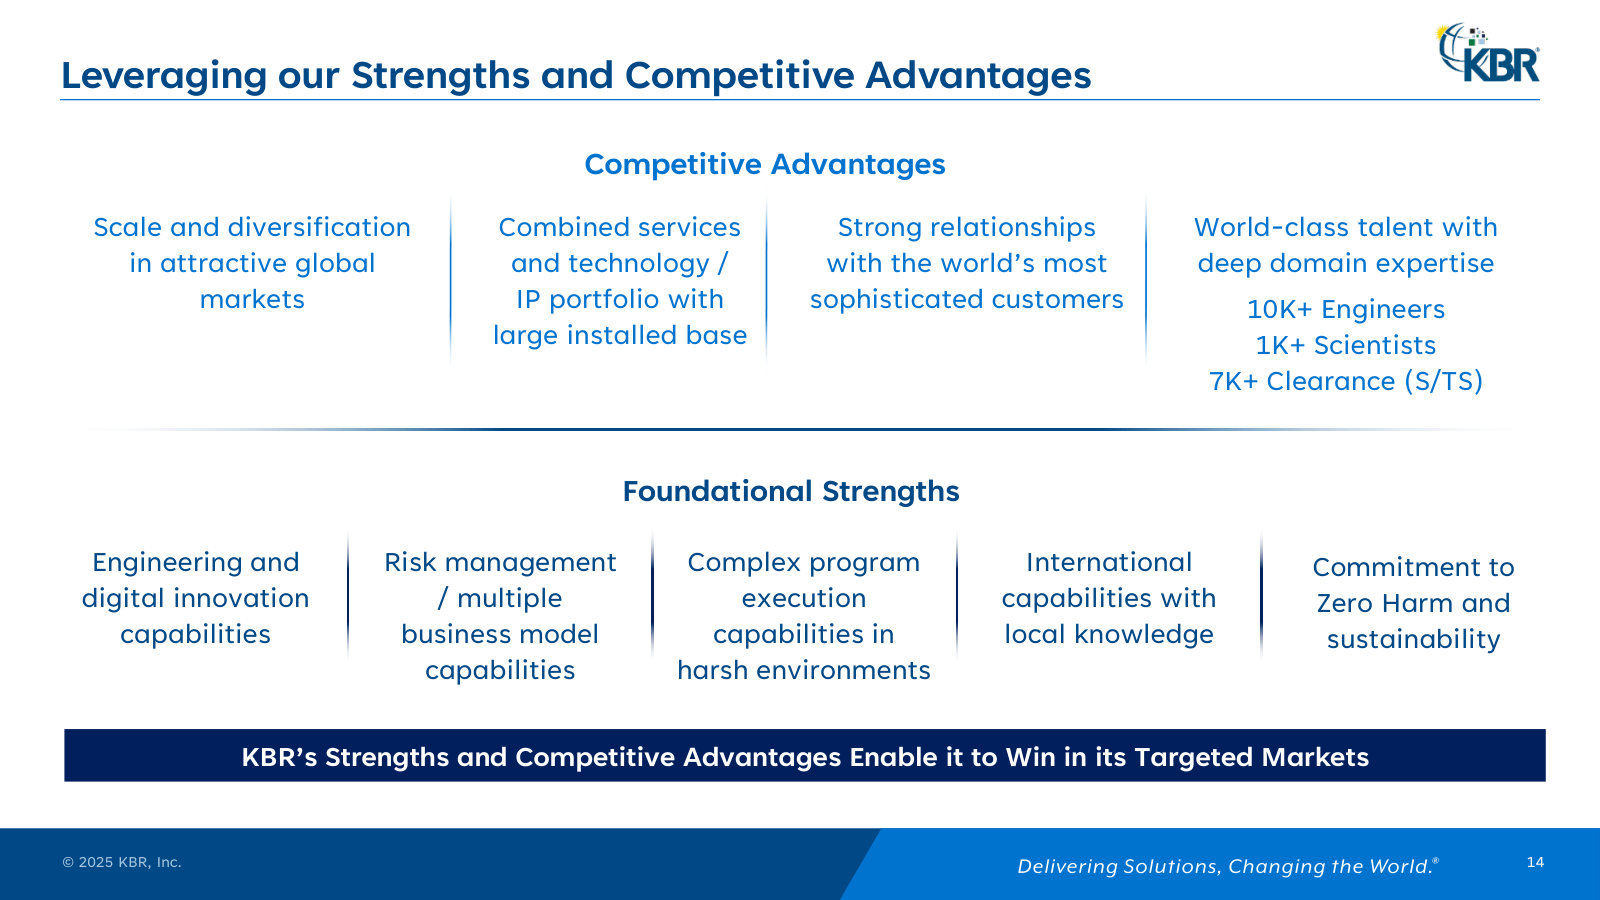
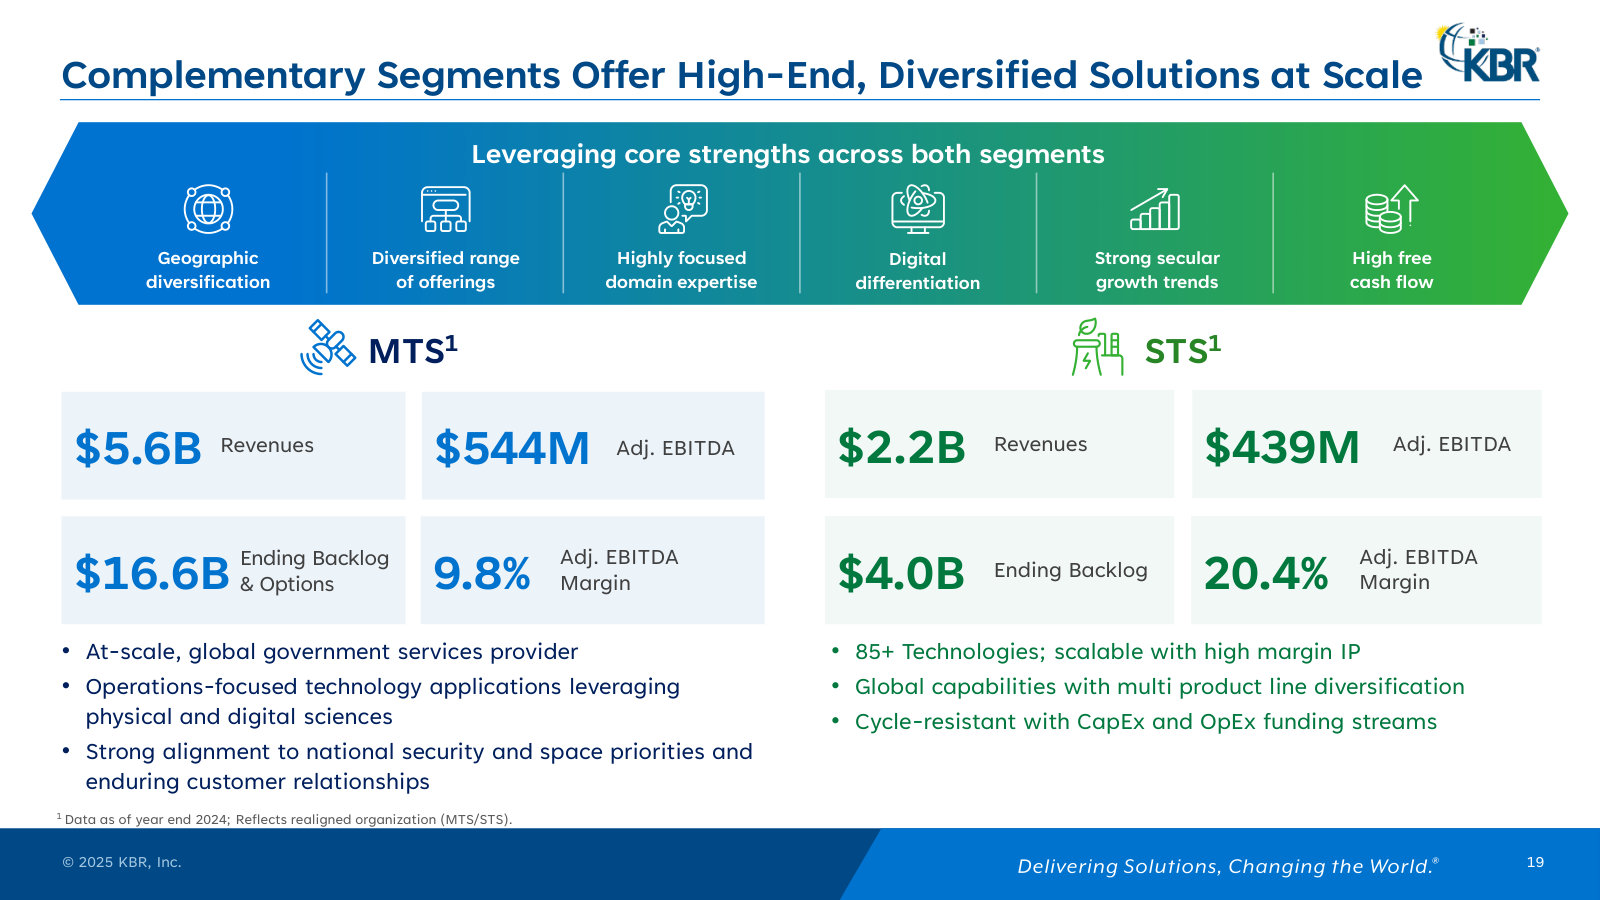
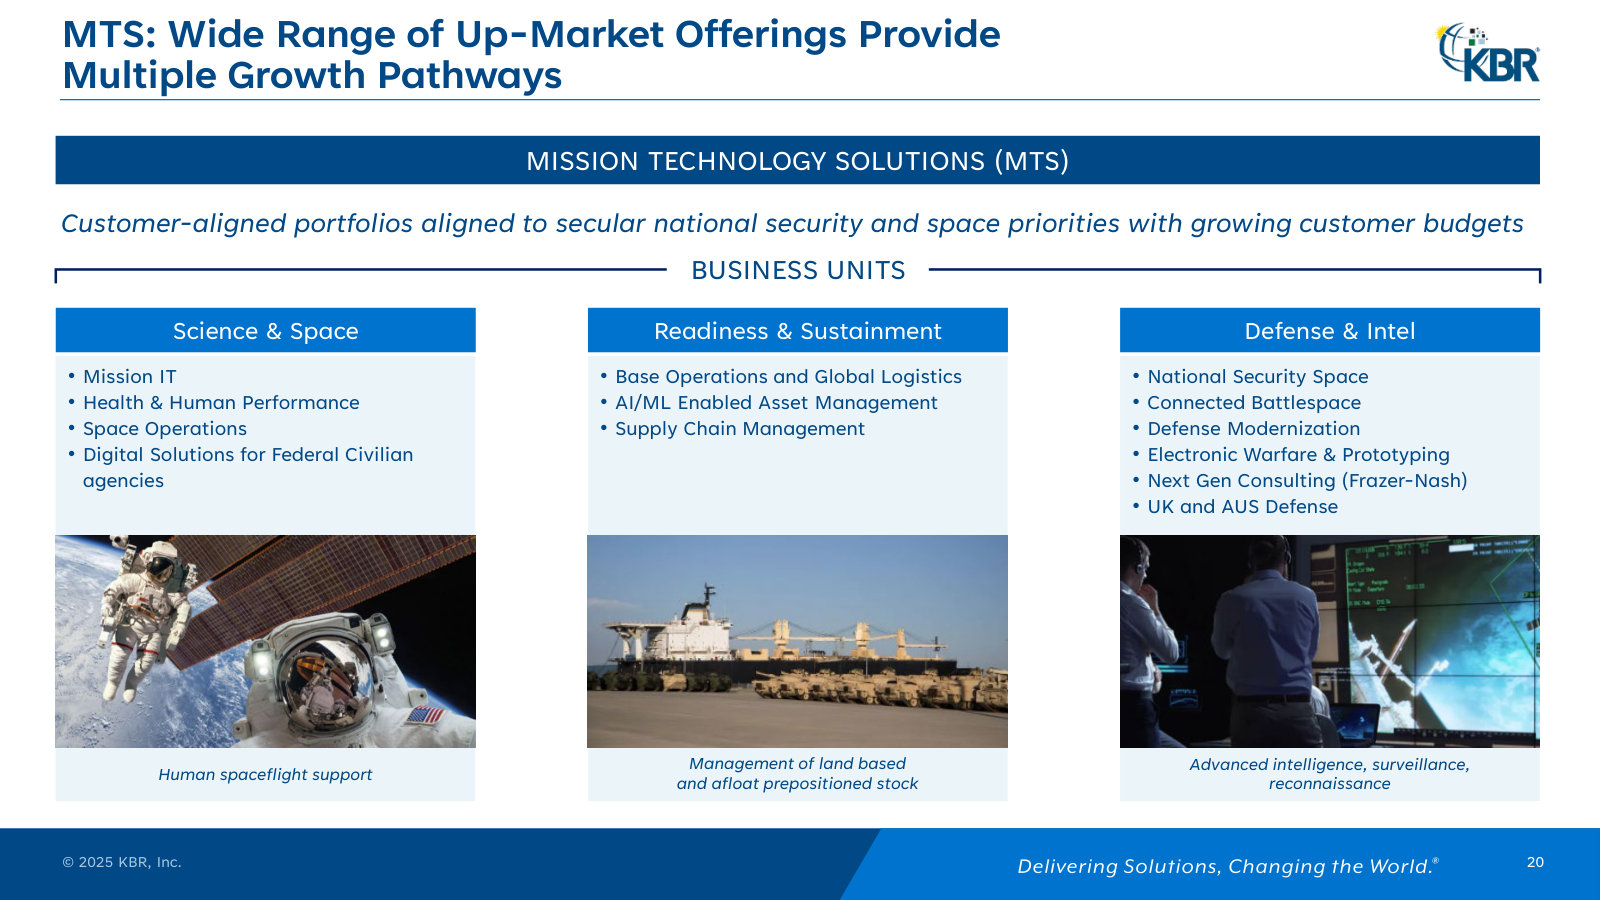
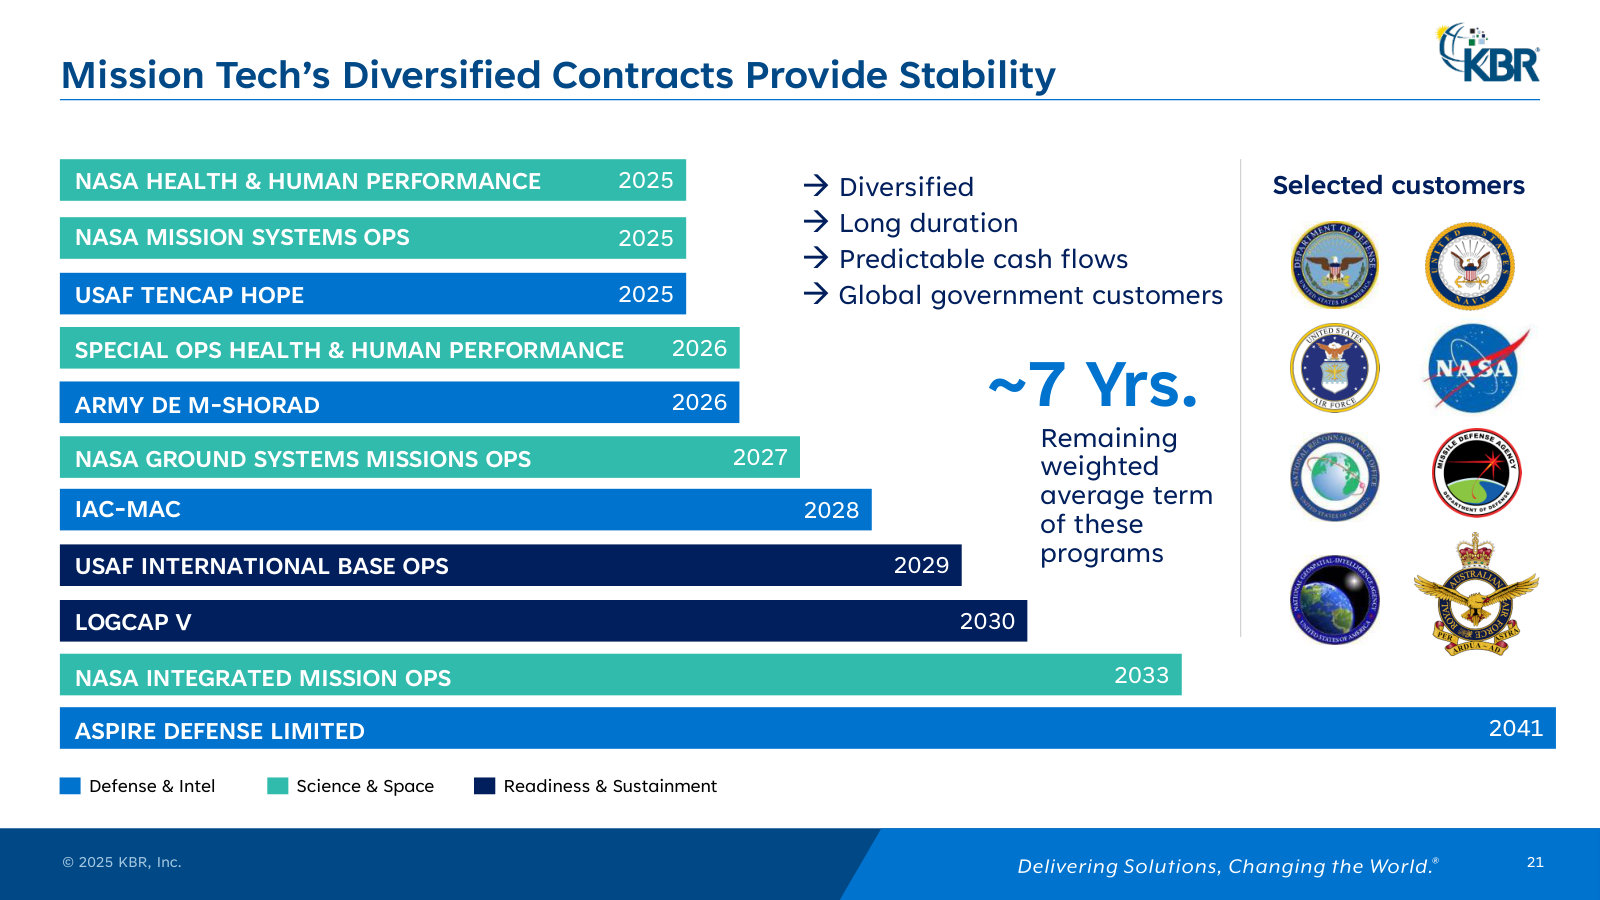
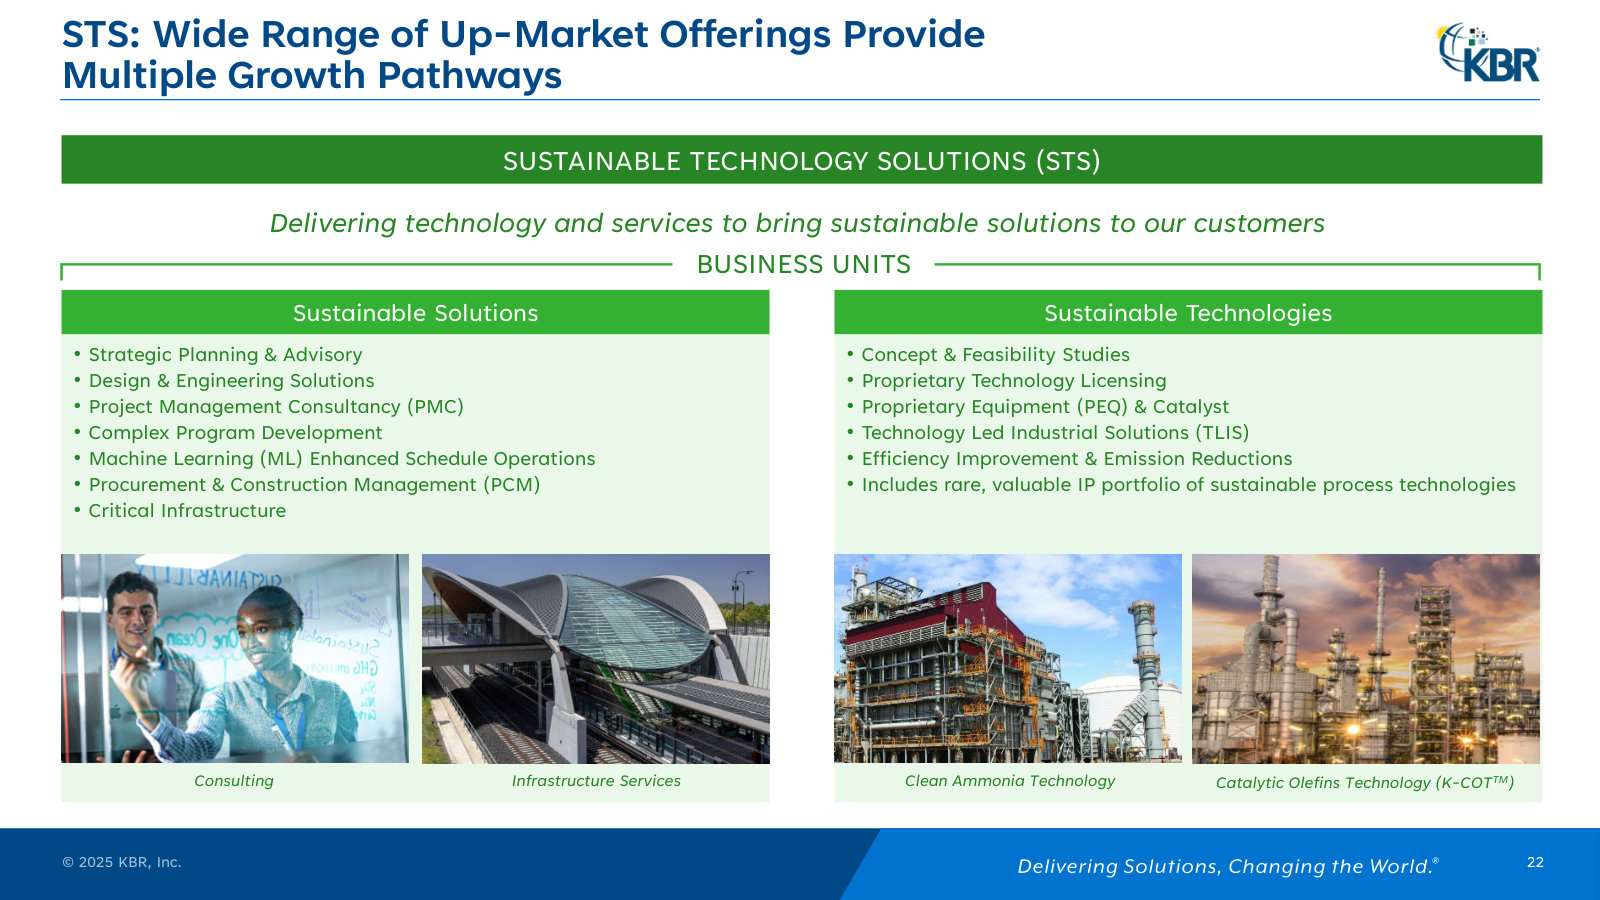
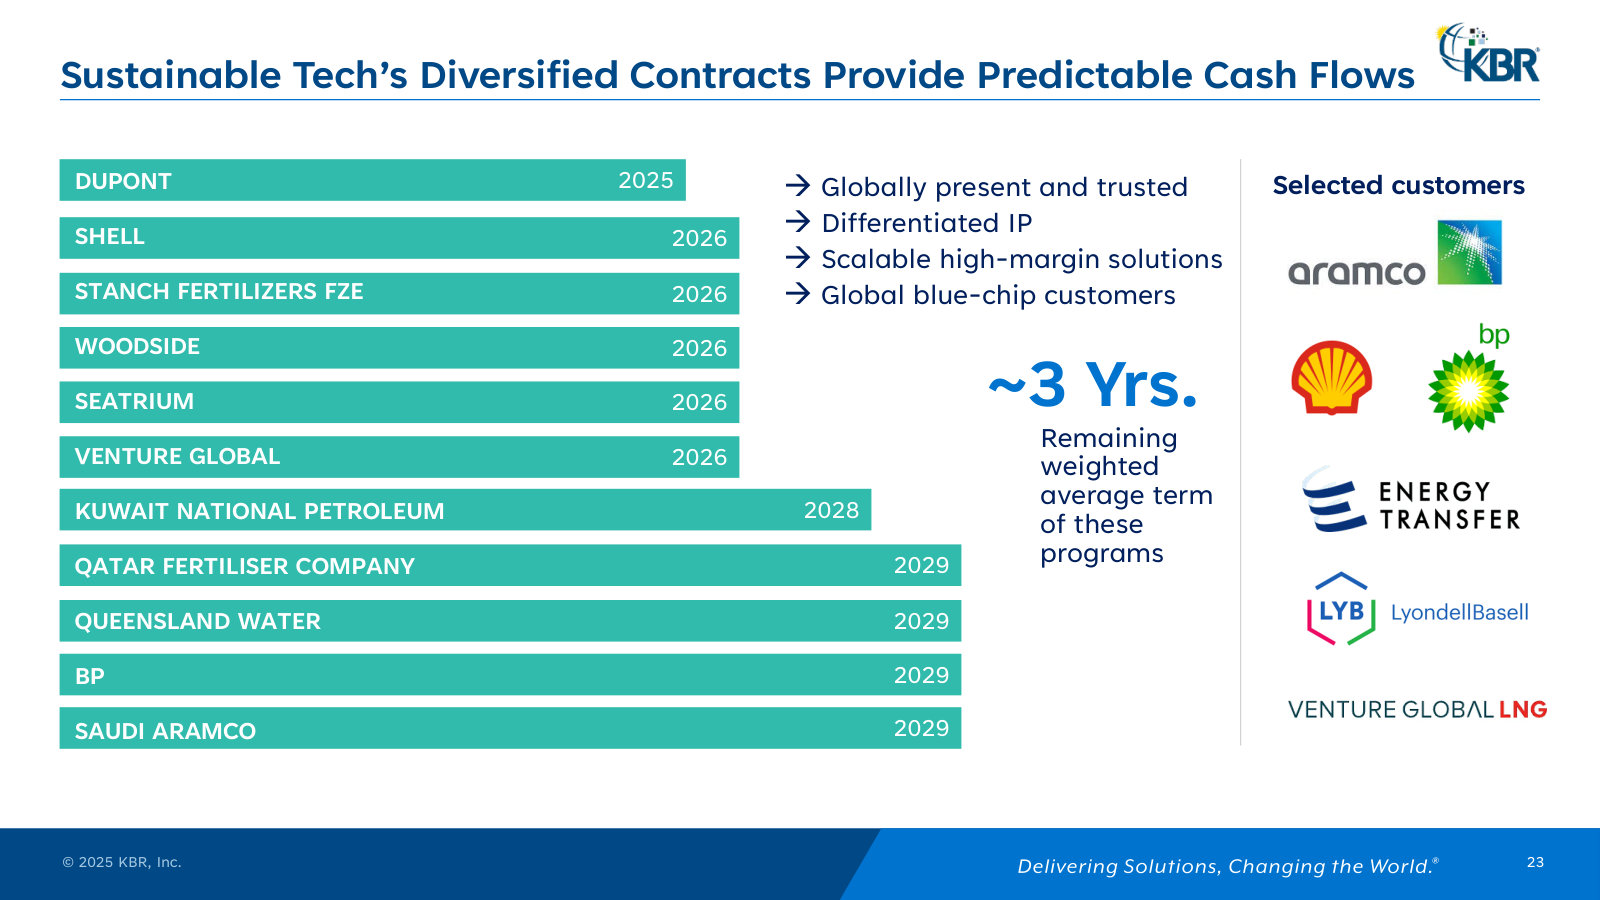
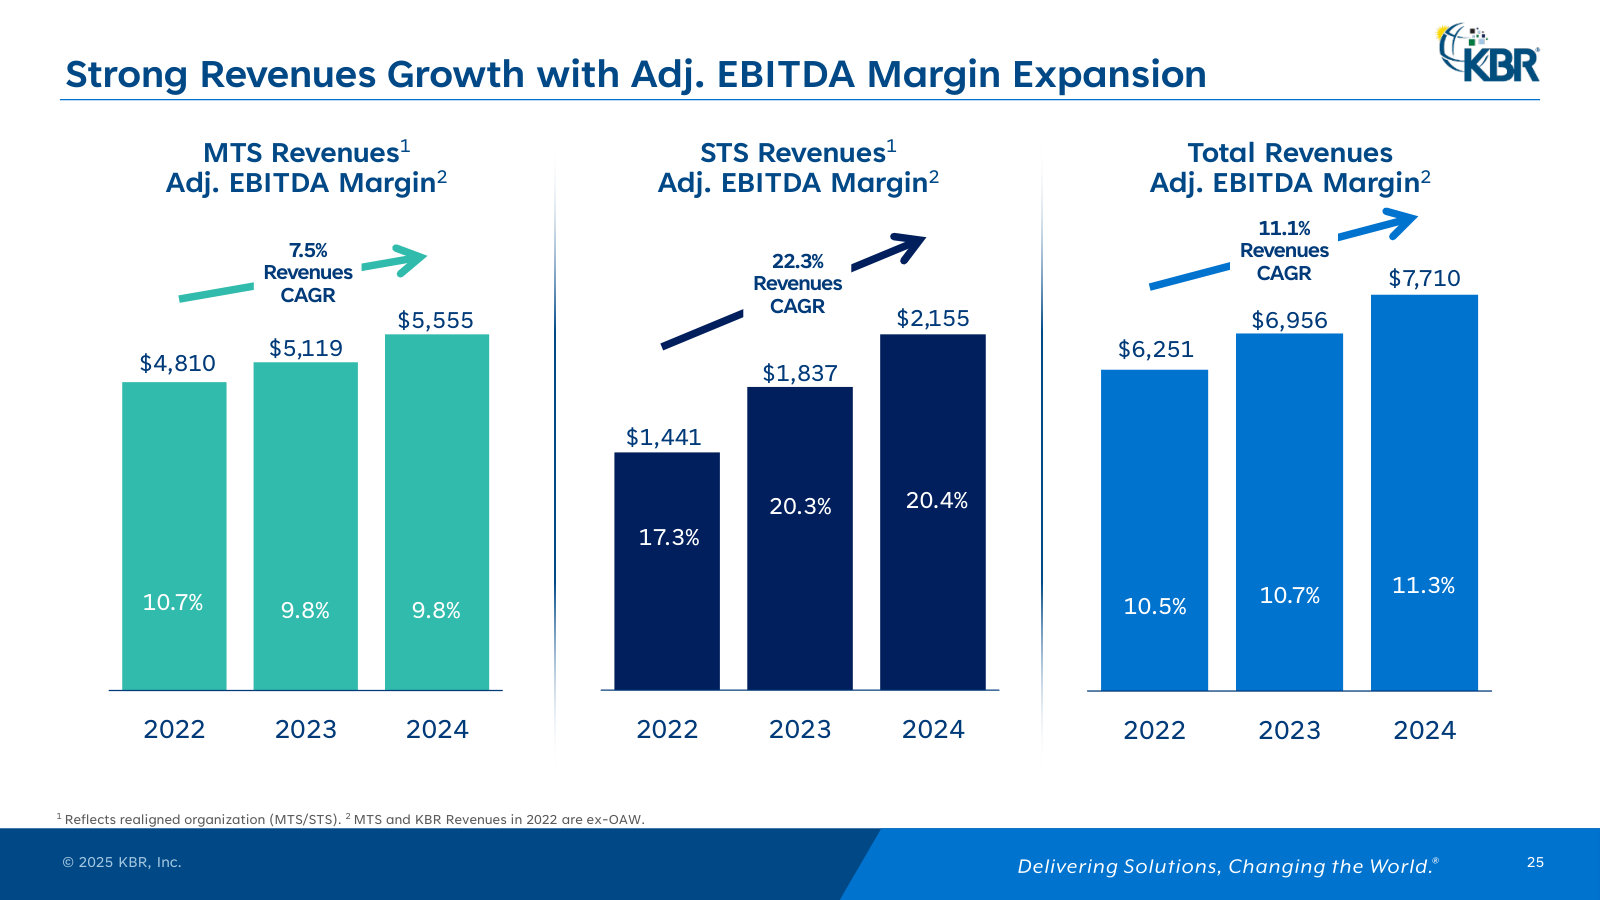
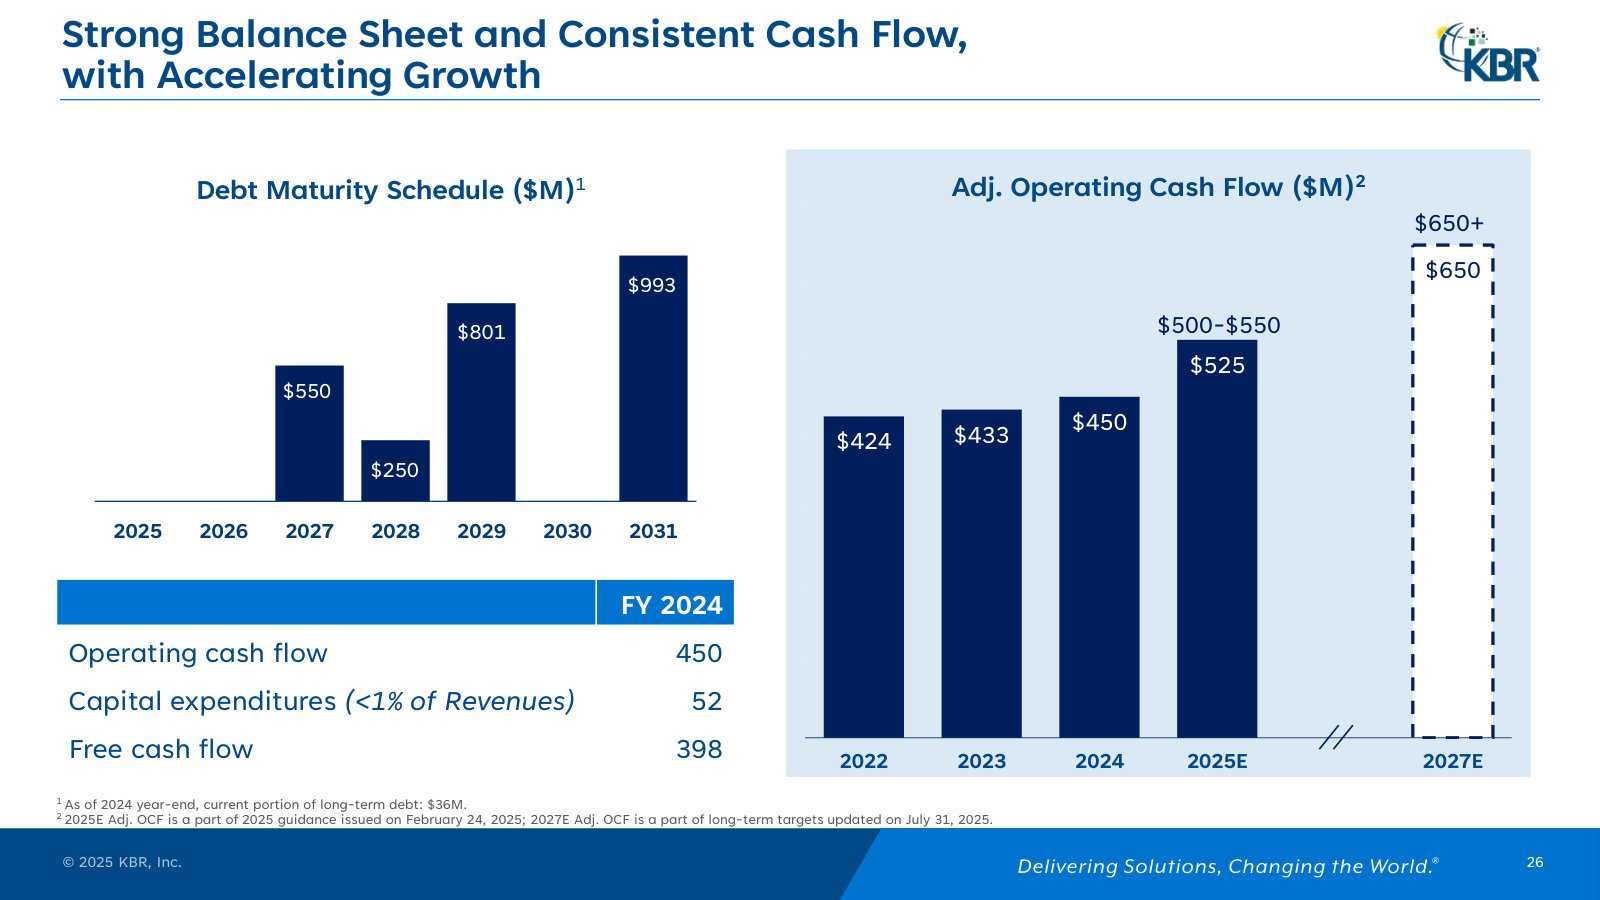
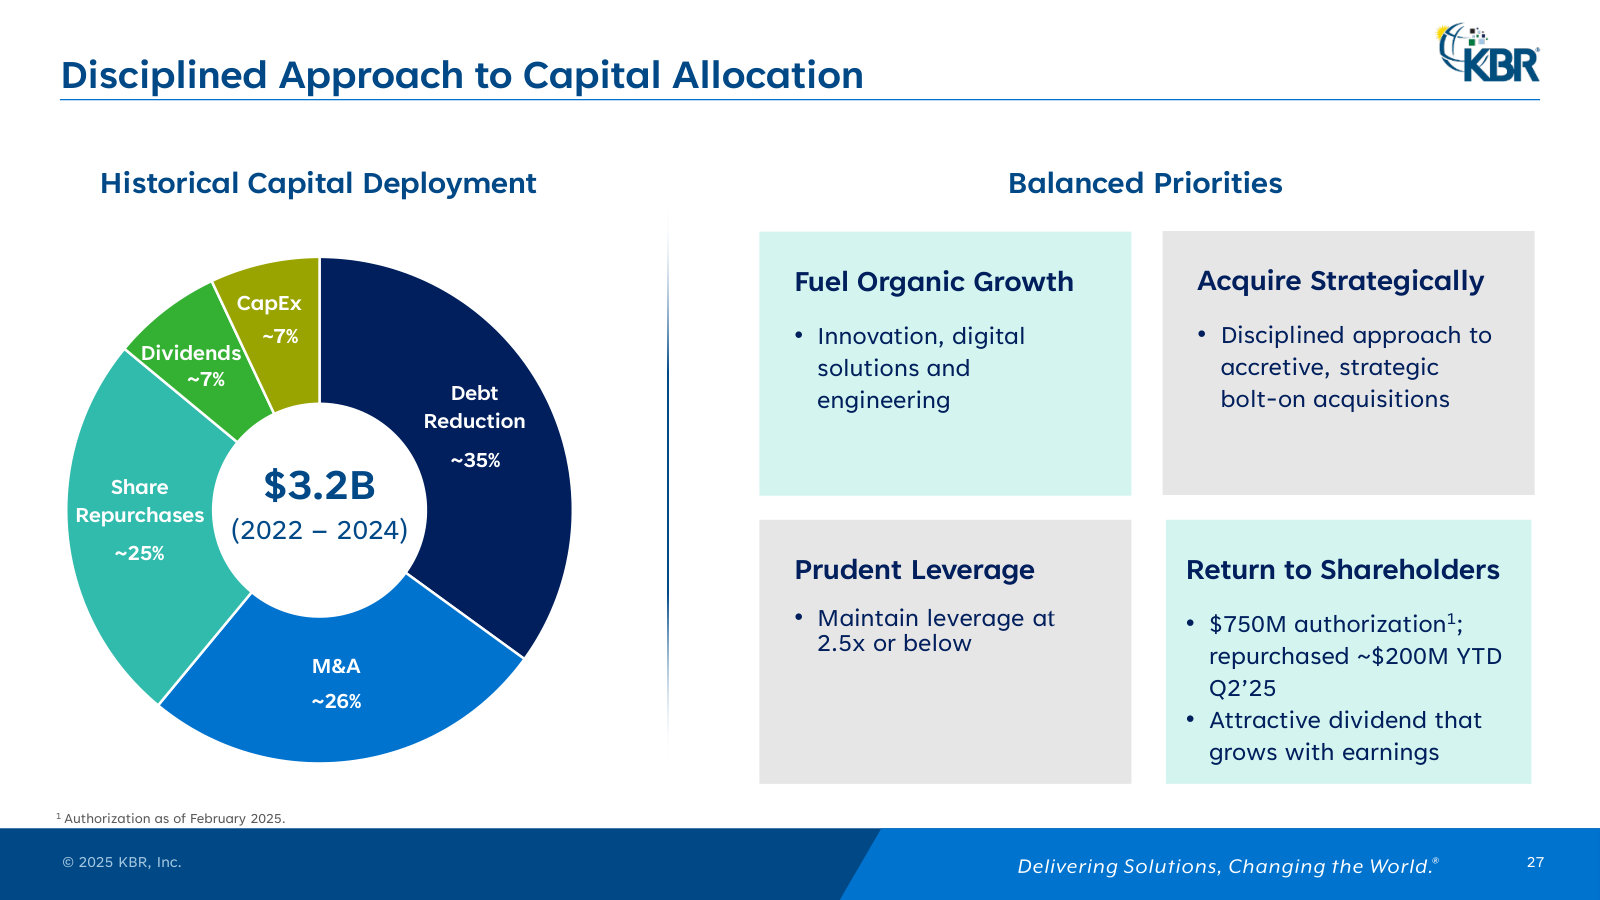
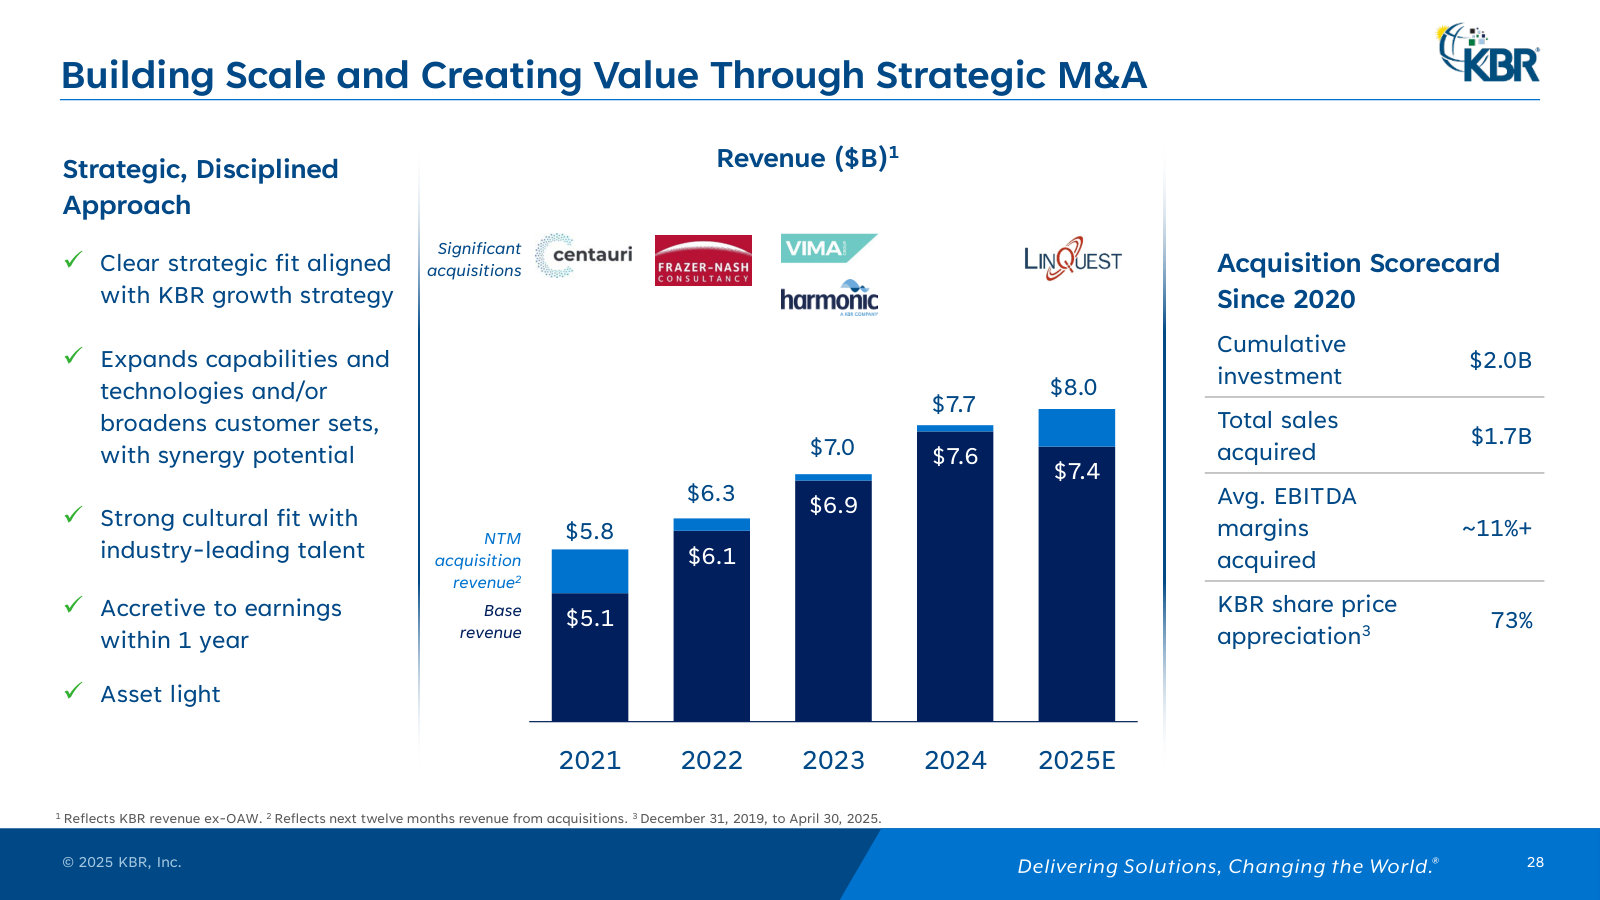
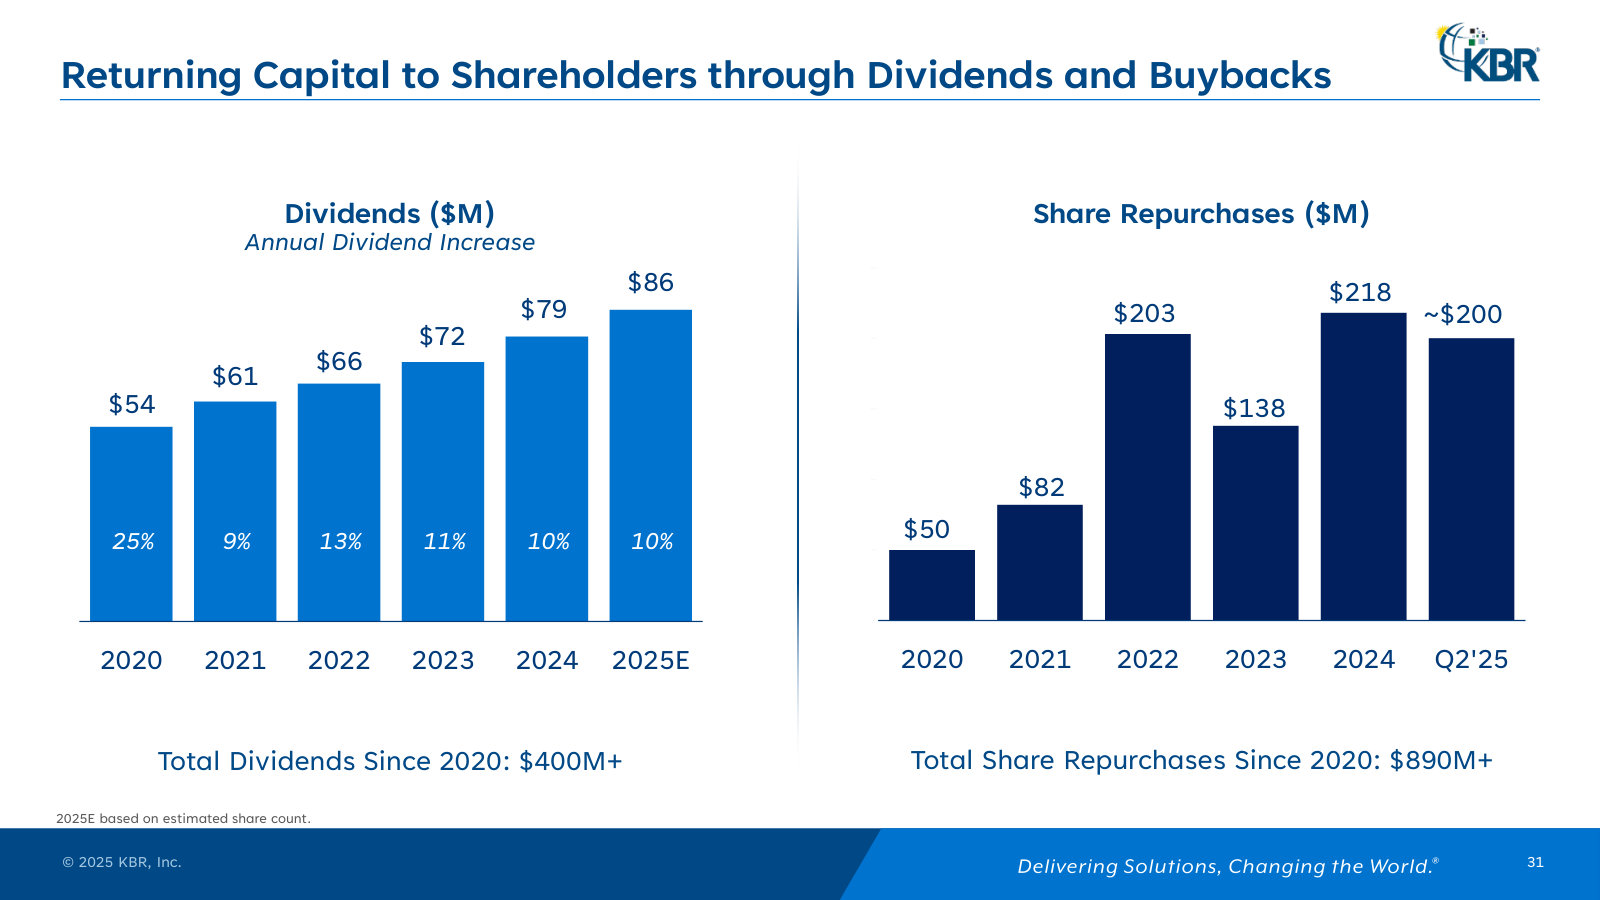
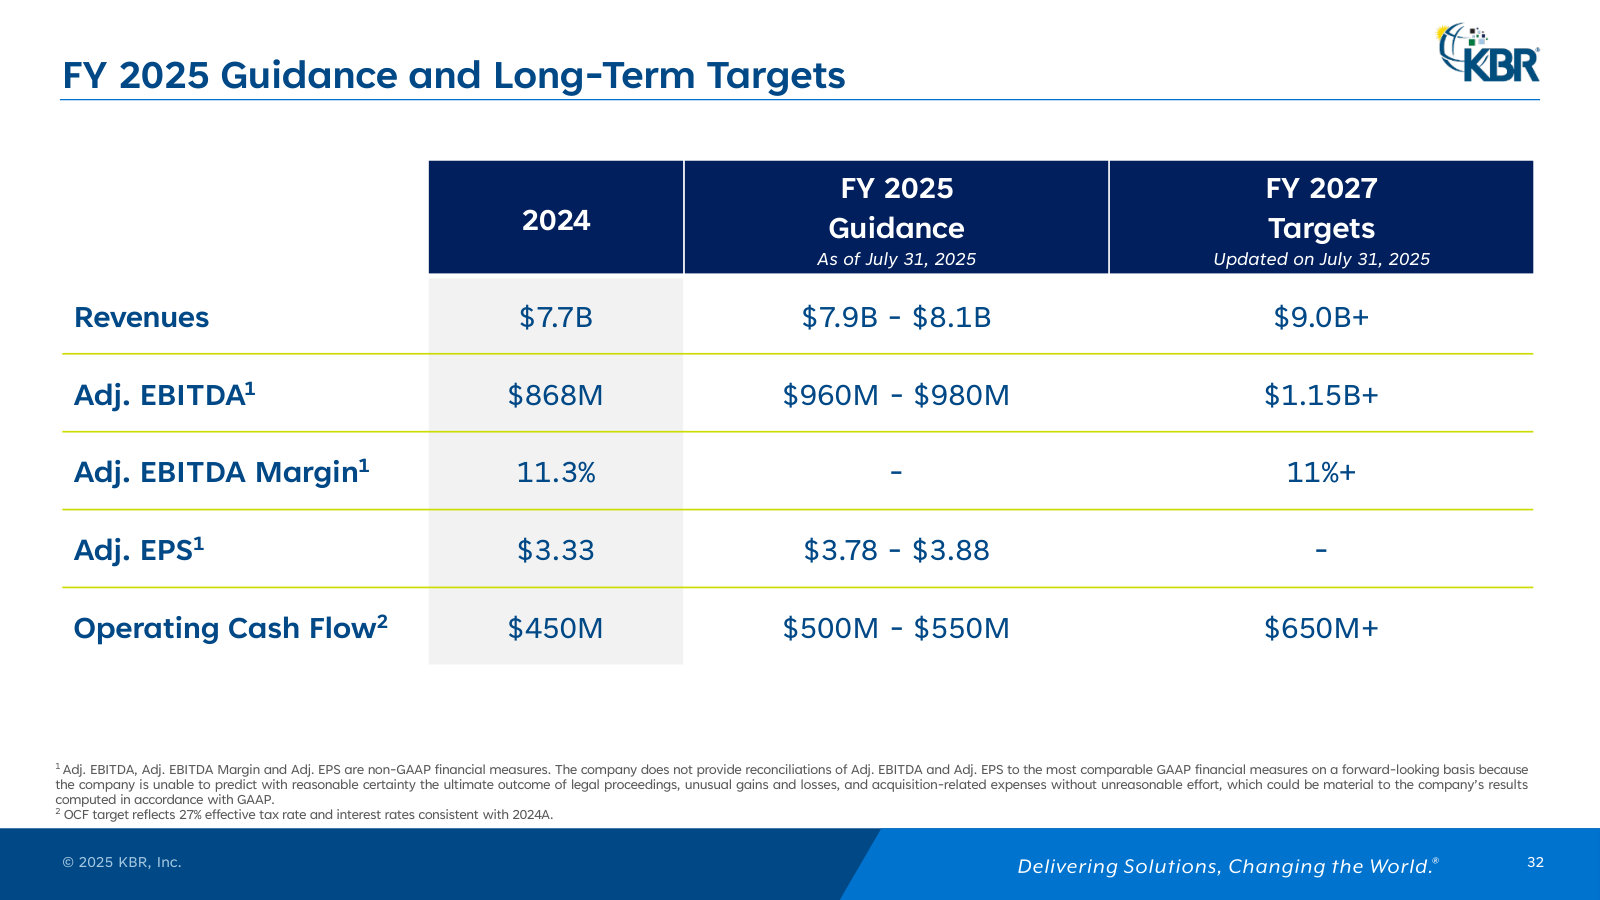
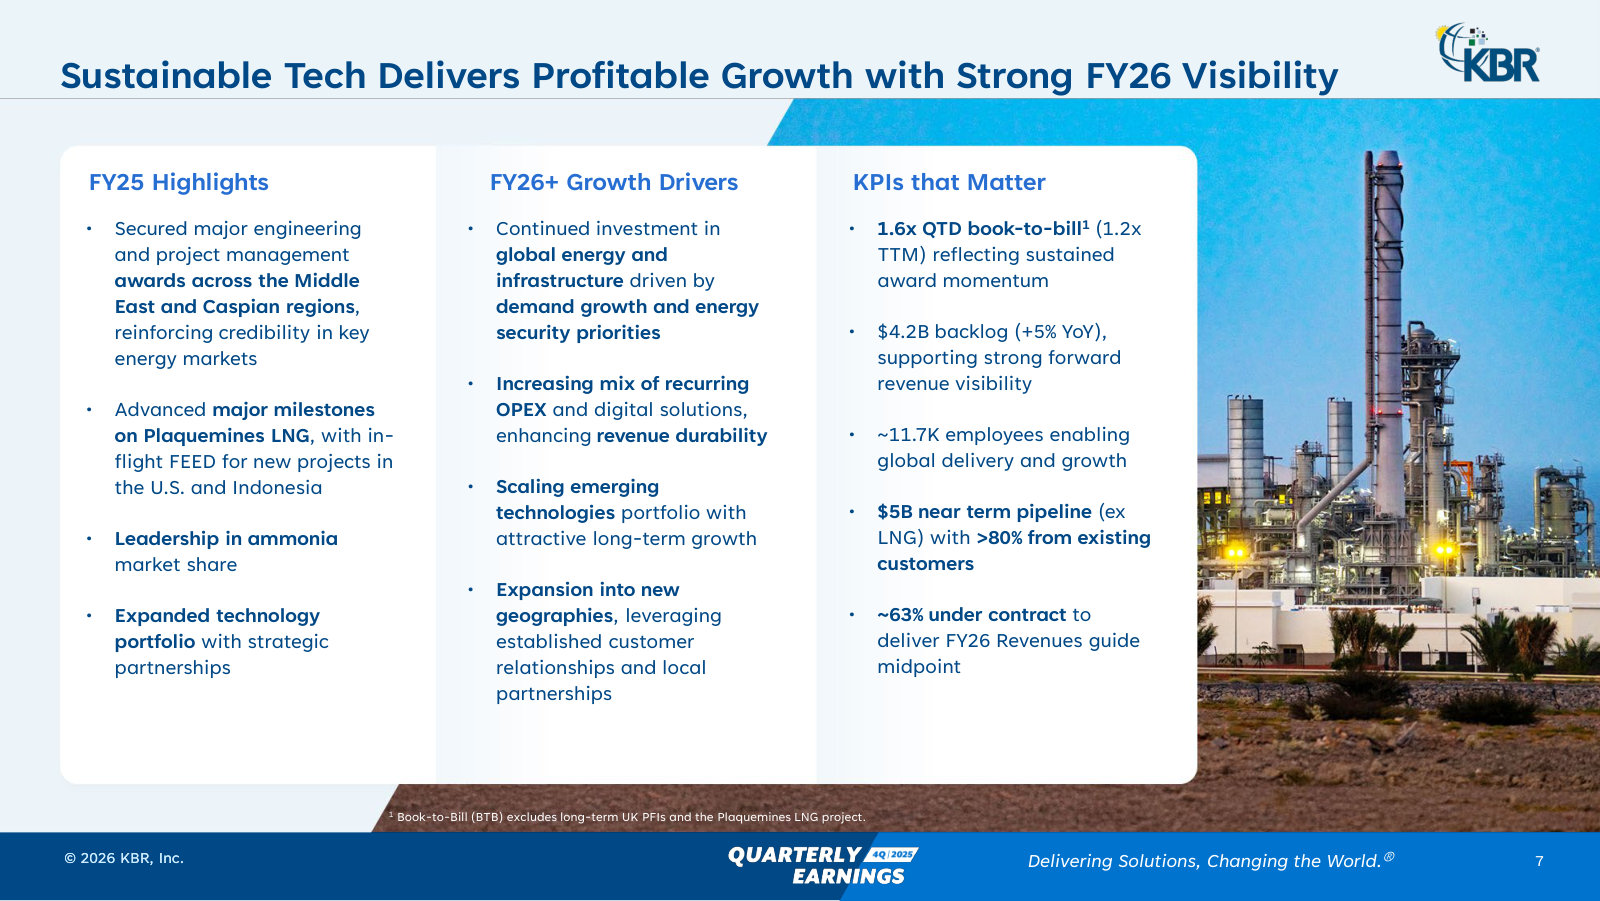
KBR, Inc.'s management explains the business in its own materials. The slides below do the most of that work, pulled from the documents preserved in Sources. Each source link opens the complete presentation at that slide in a new tab.
Investor Presentation — July 2025 — July 2025
KBR's own company overview: what it does, its two segments, unit economics and strategy in one deck. Predates the 2026 spin-off. · Open the full document →
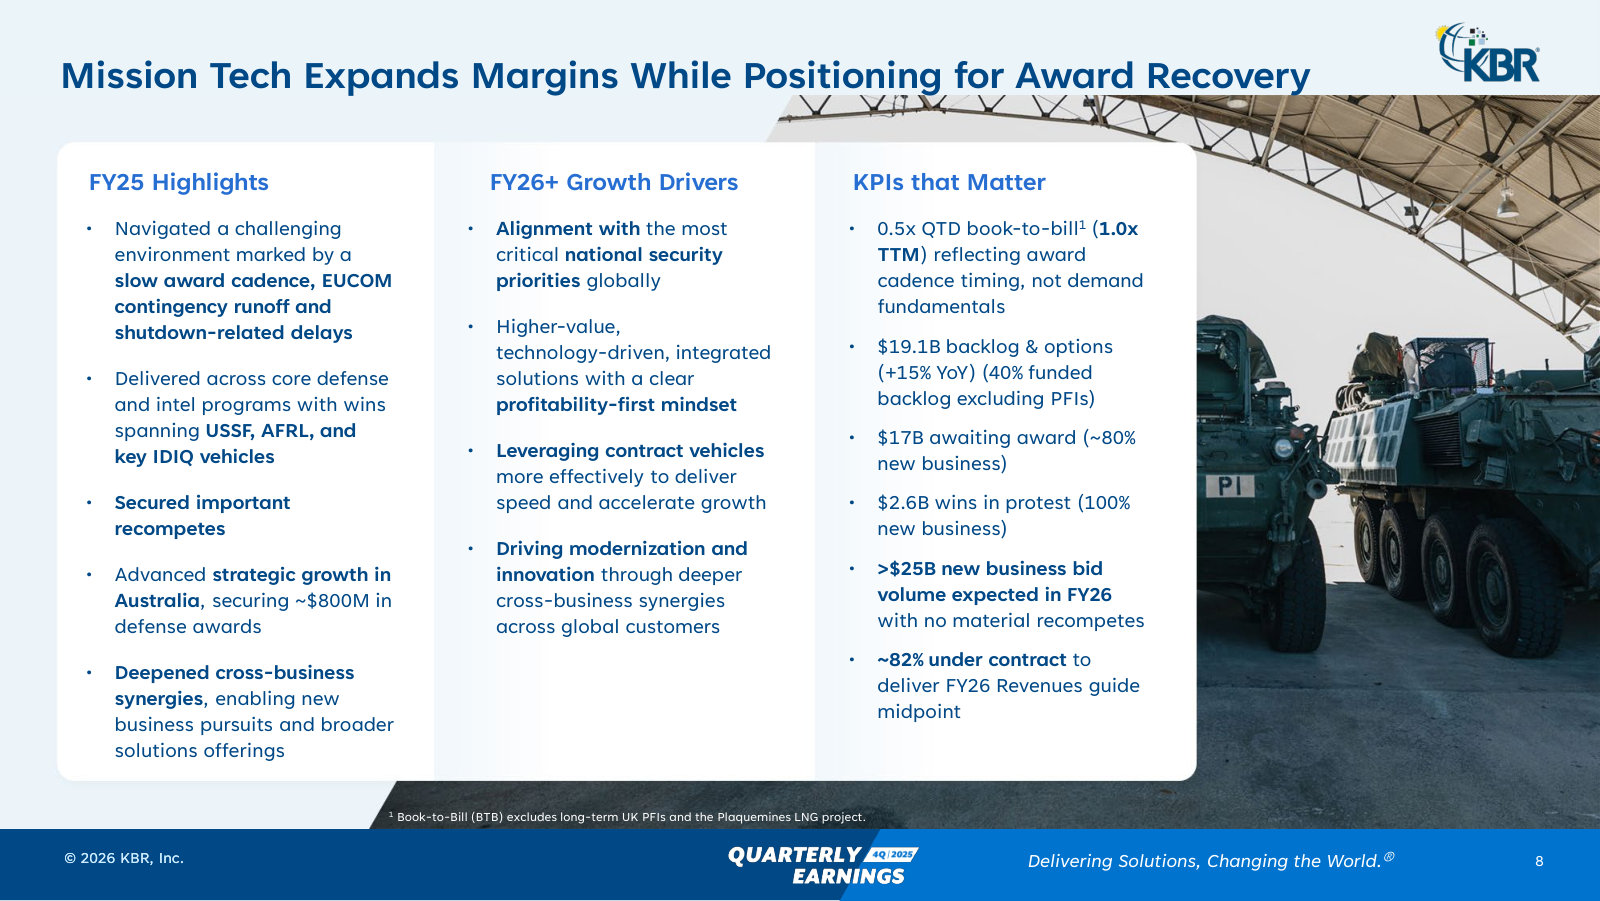
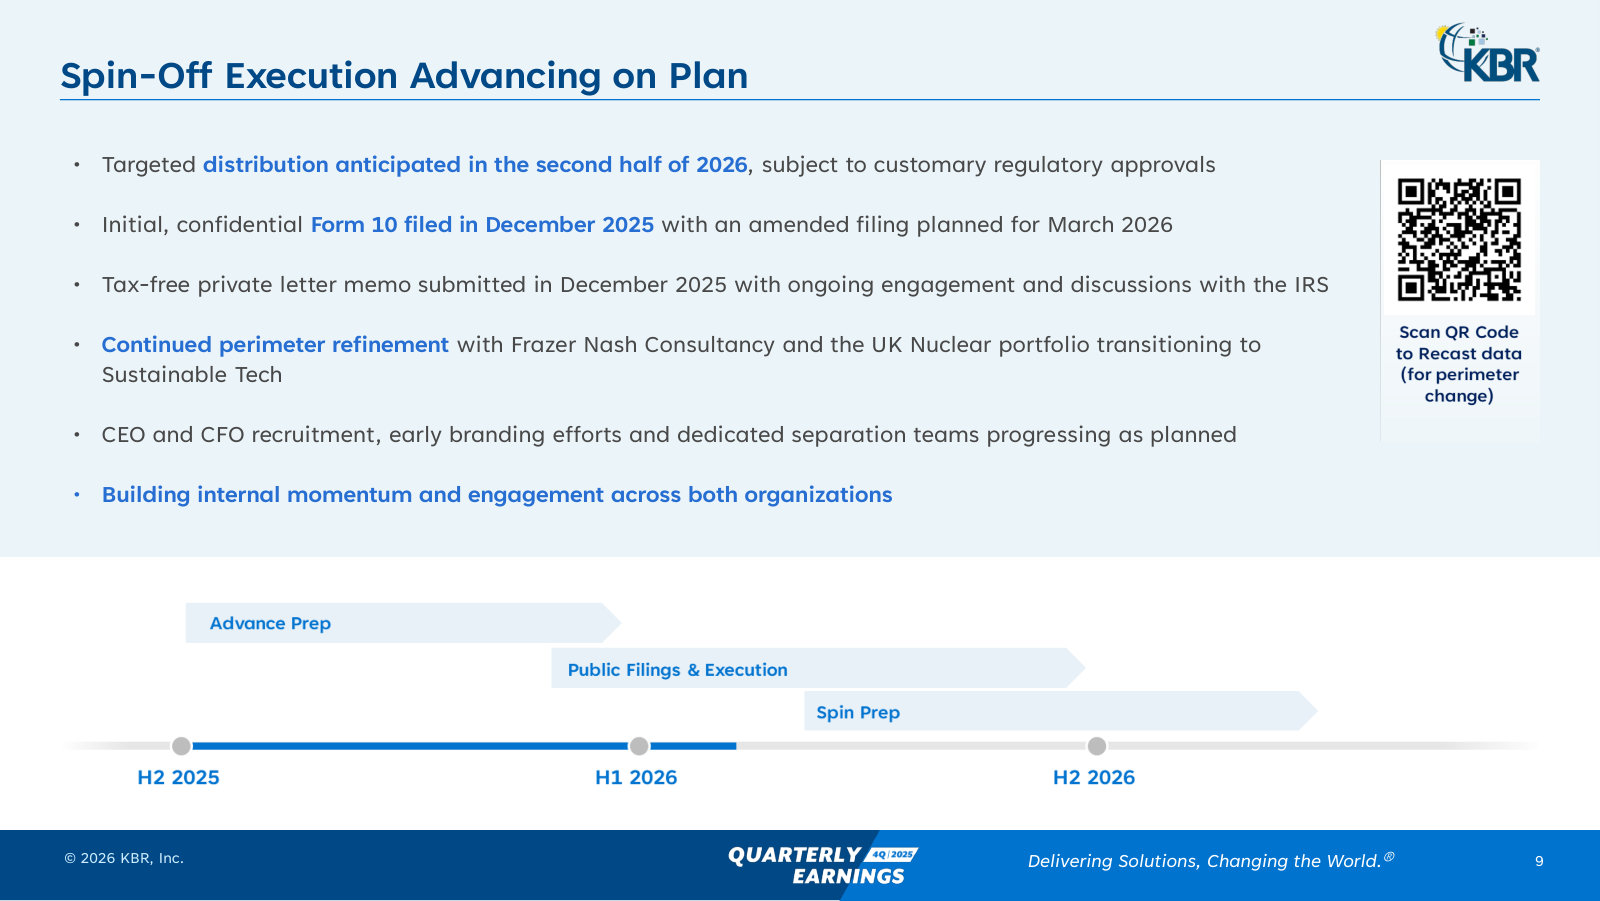
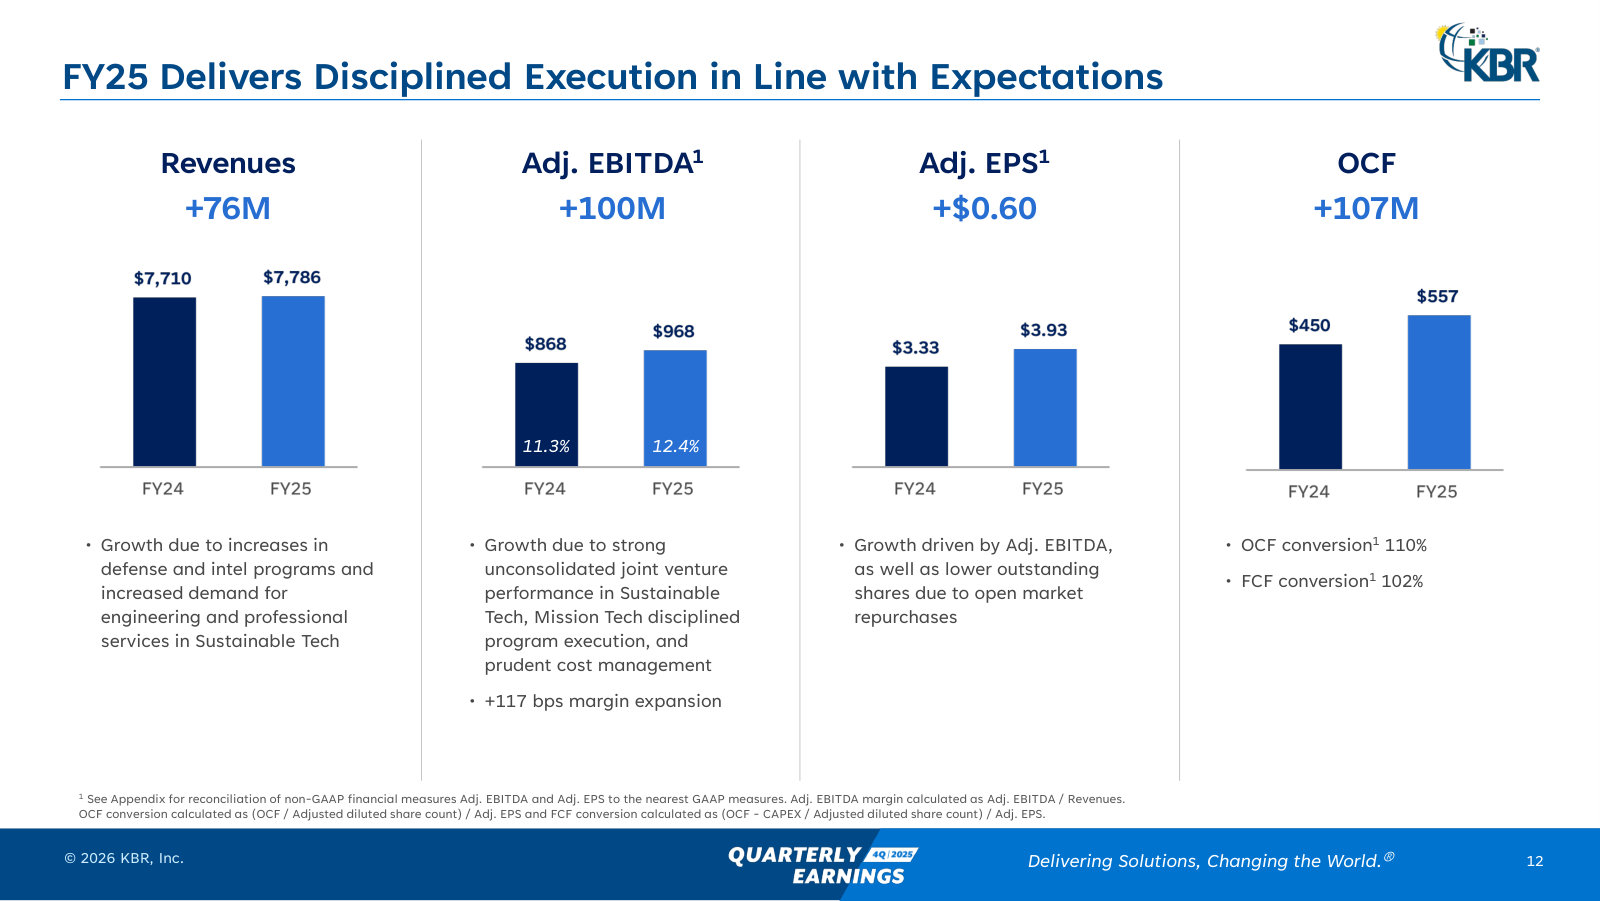
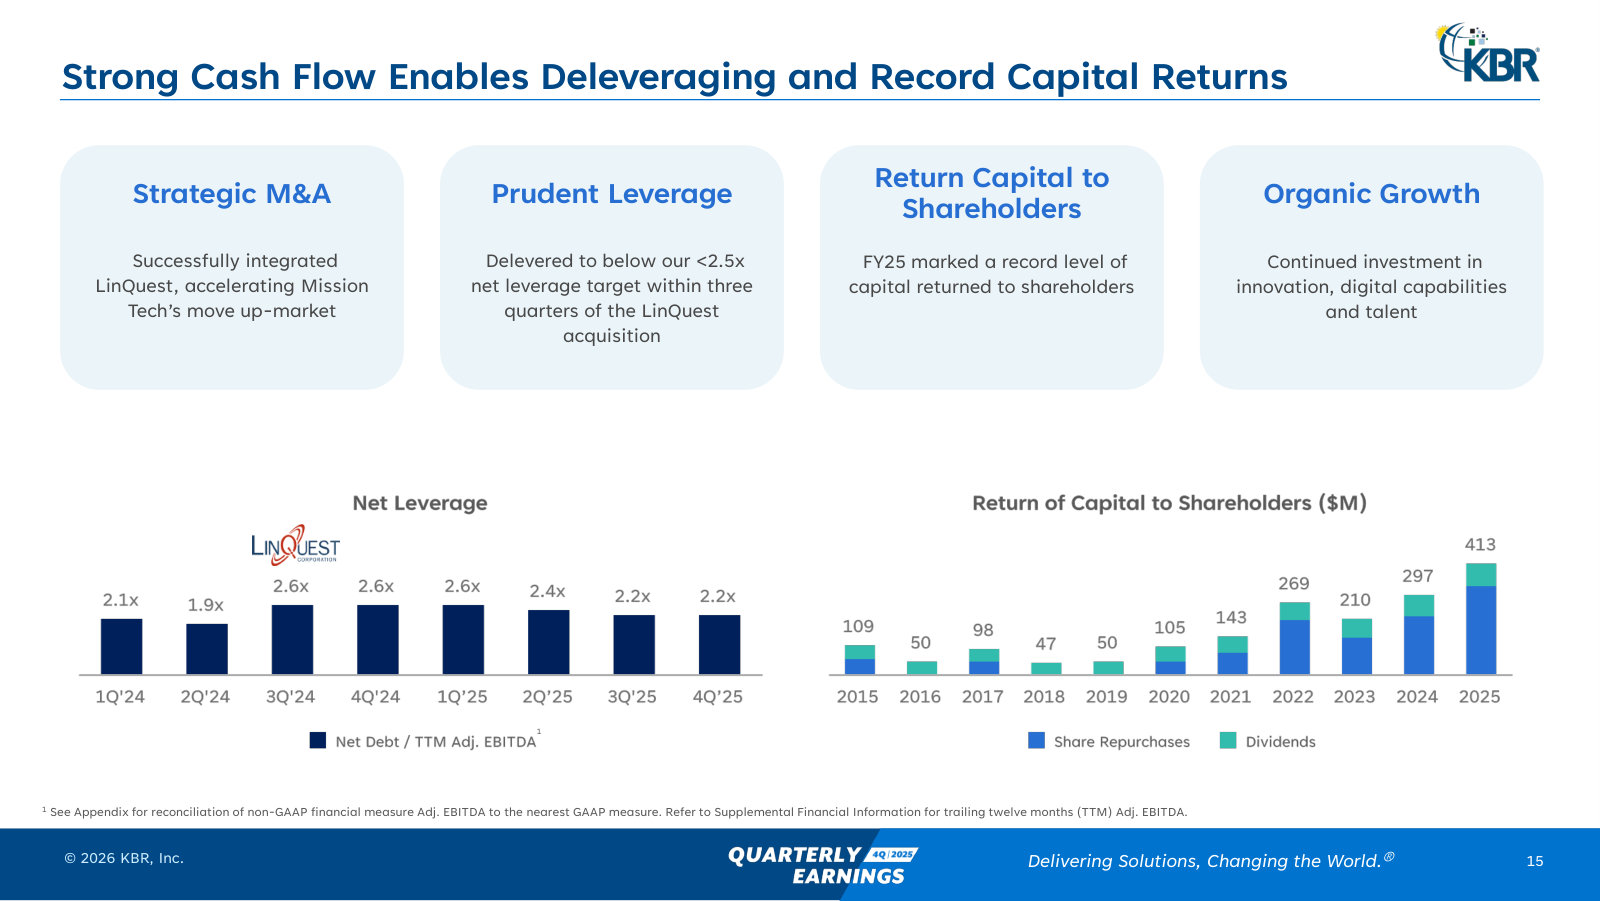
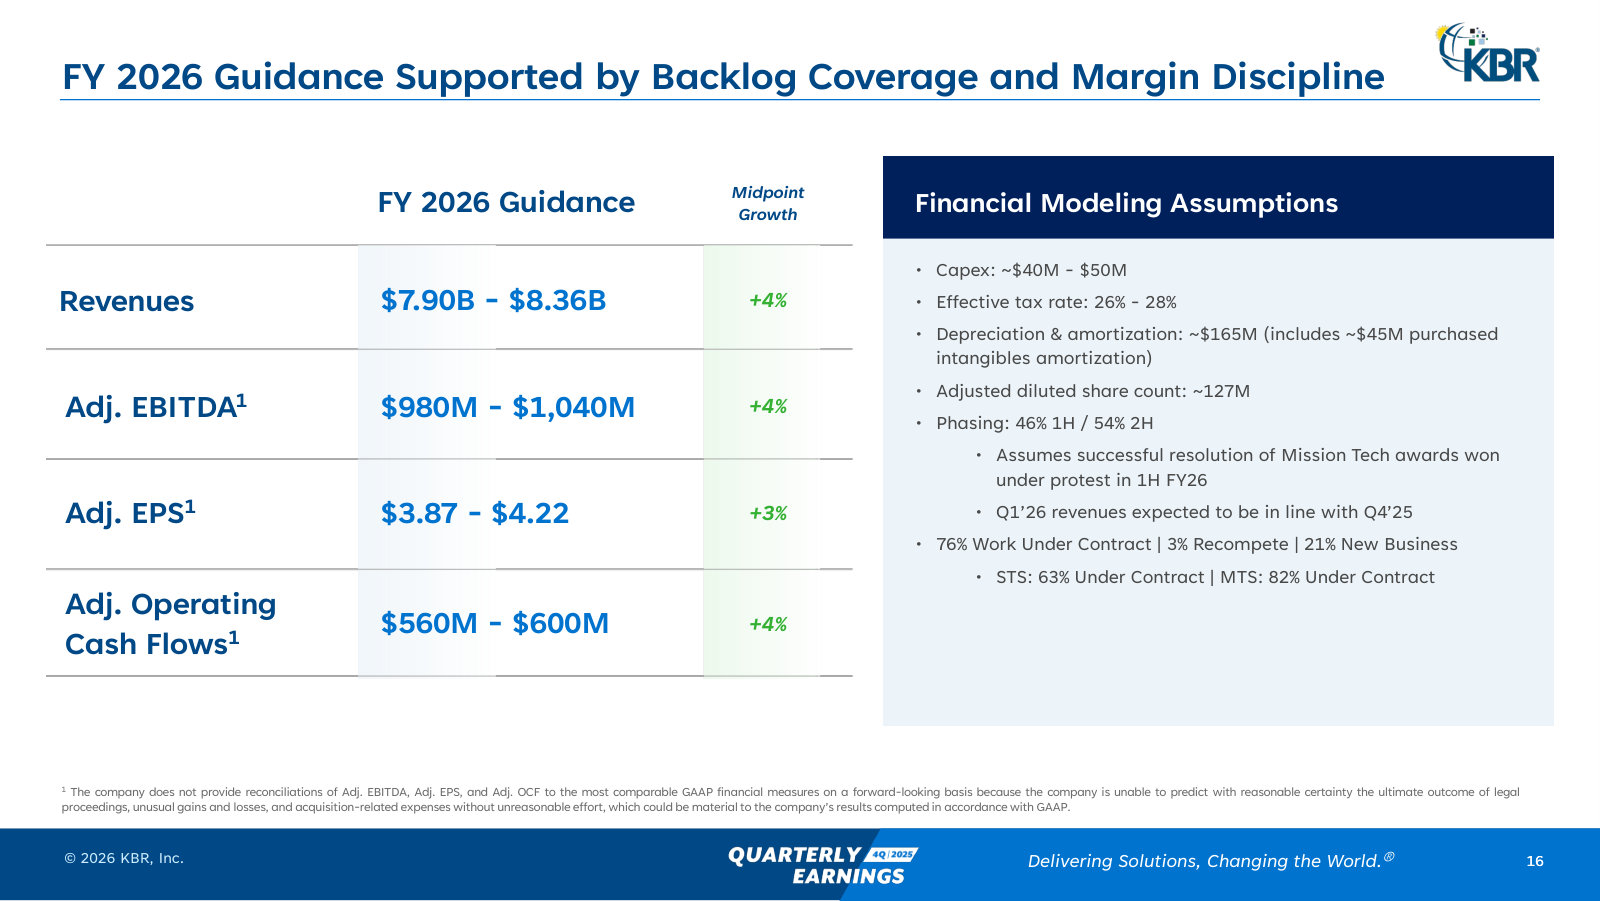
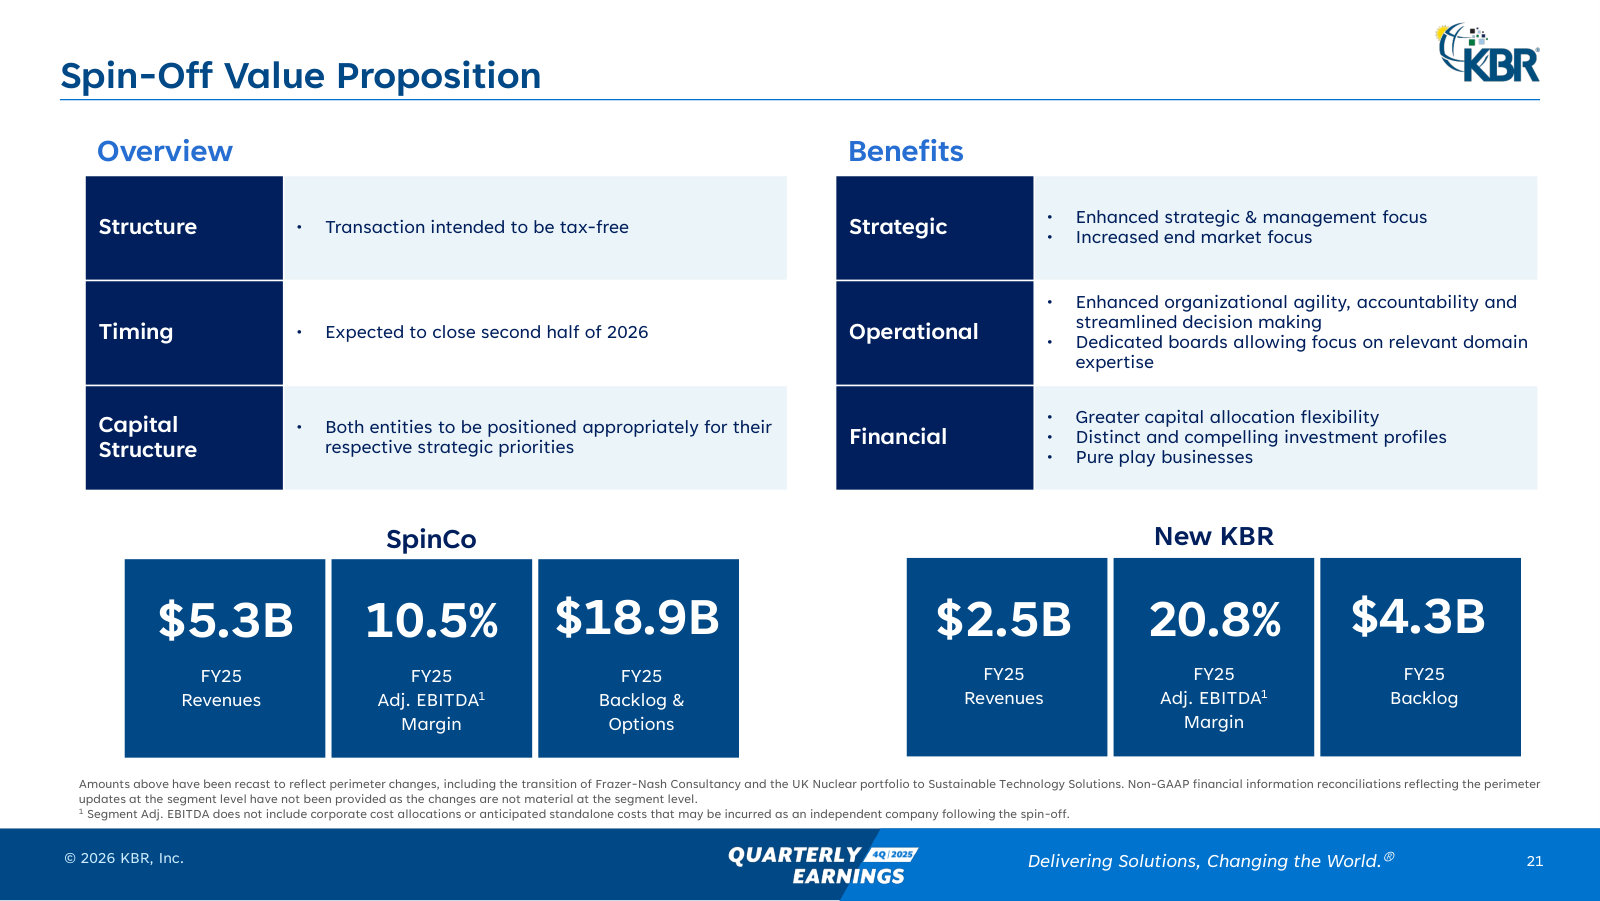
4Q & Full-Year 2025 Earnings Presentation — 4Q/FY2025
The latest full-year results and the headline event — KBR's planned tax-free split into two companies — with FY26 guidance. · Open the full document →
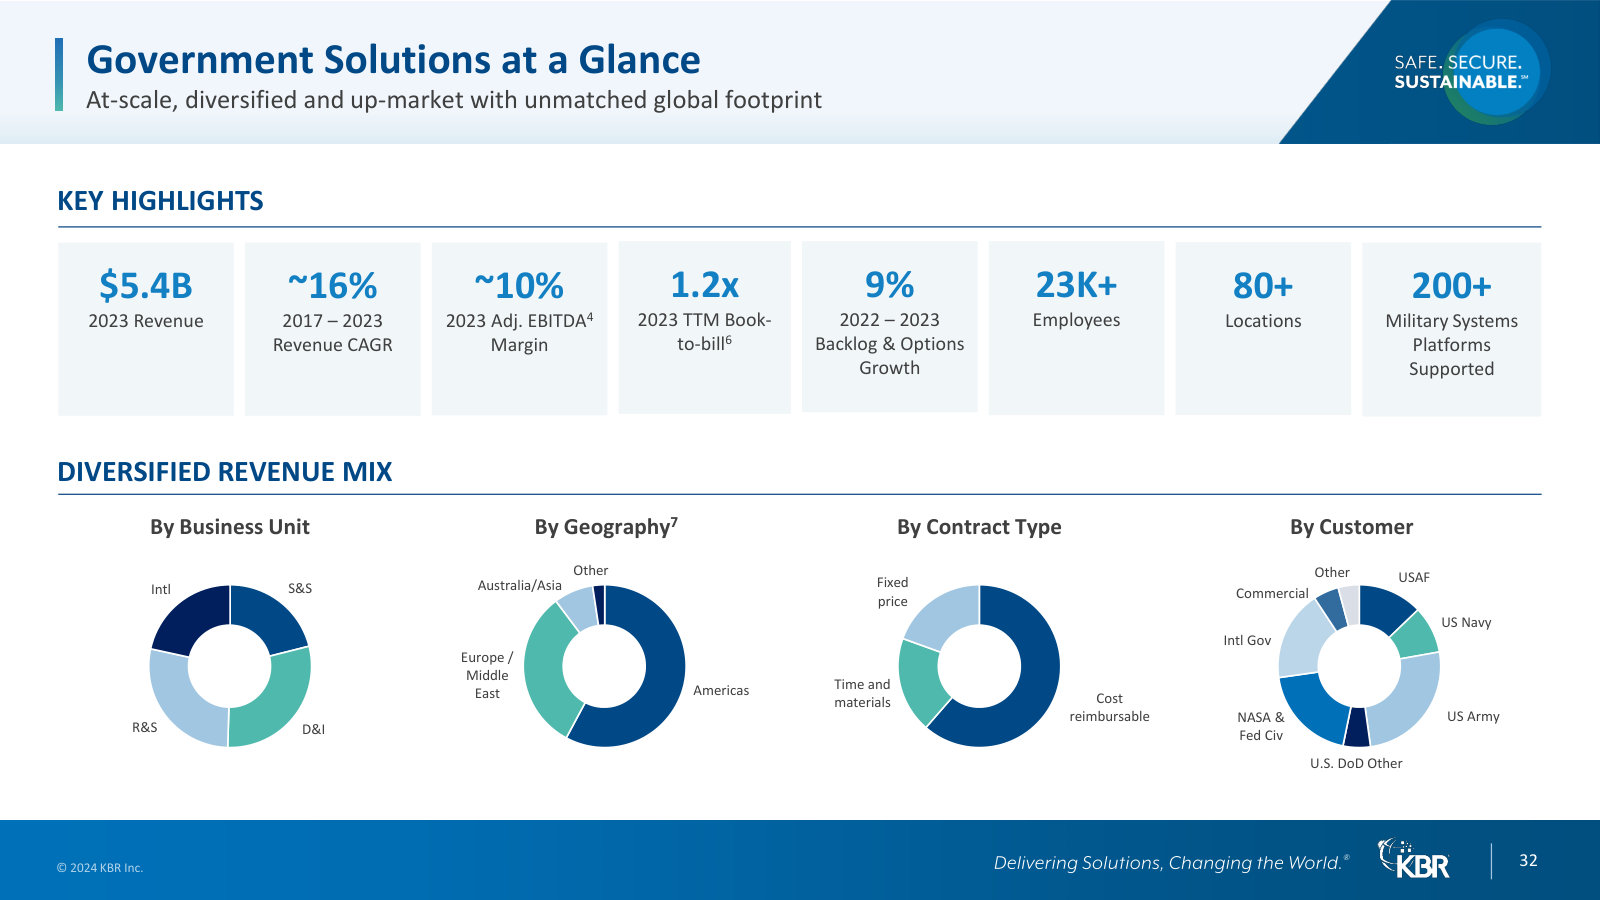
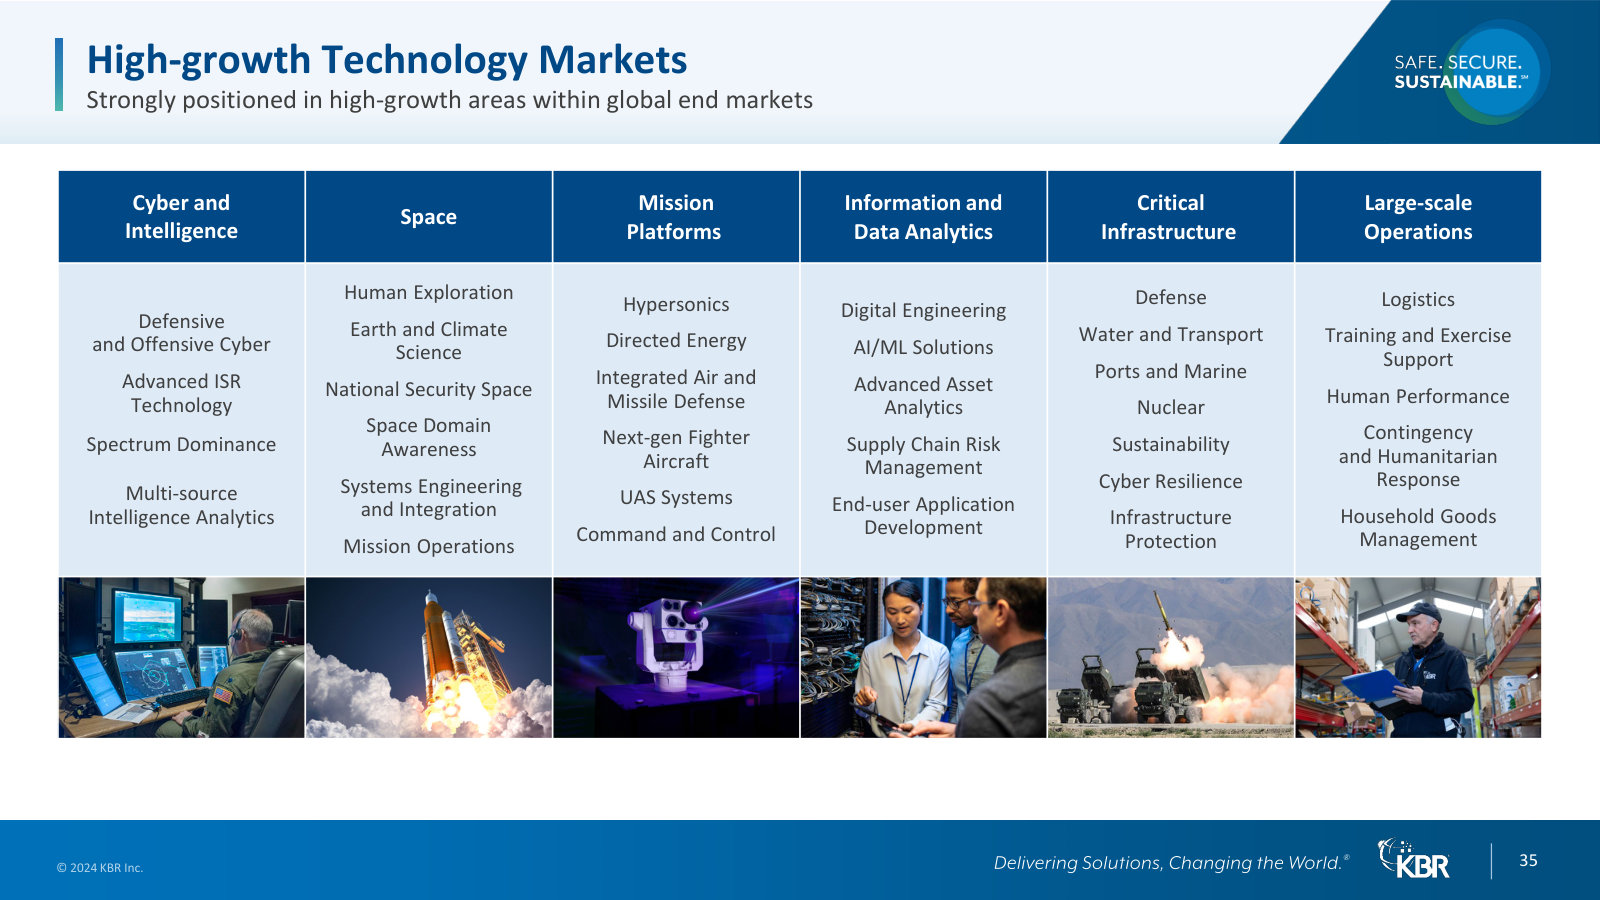
Investor Day 2024 — May 2024
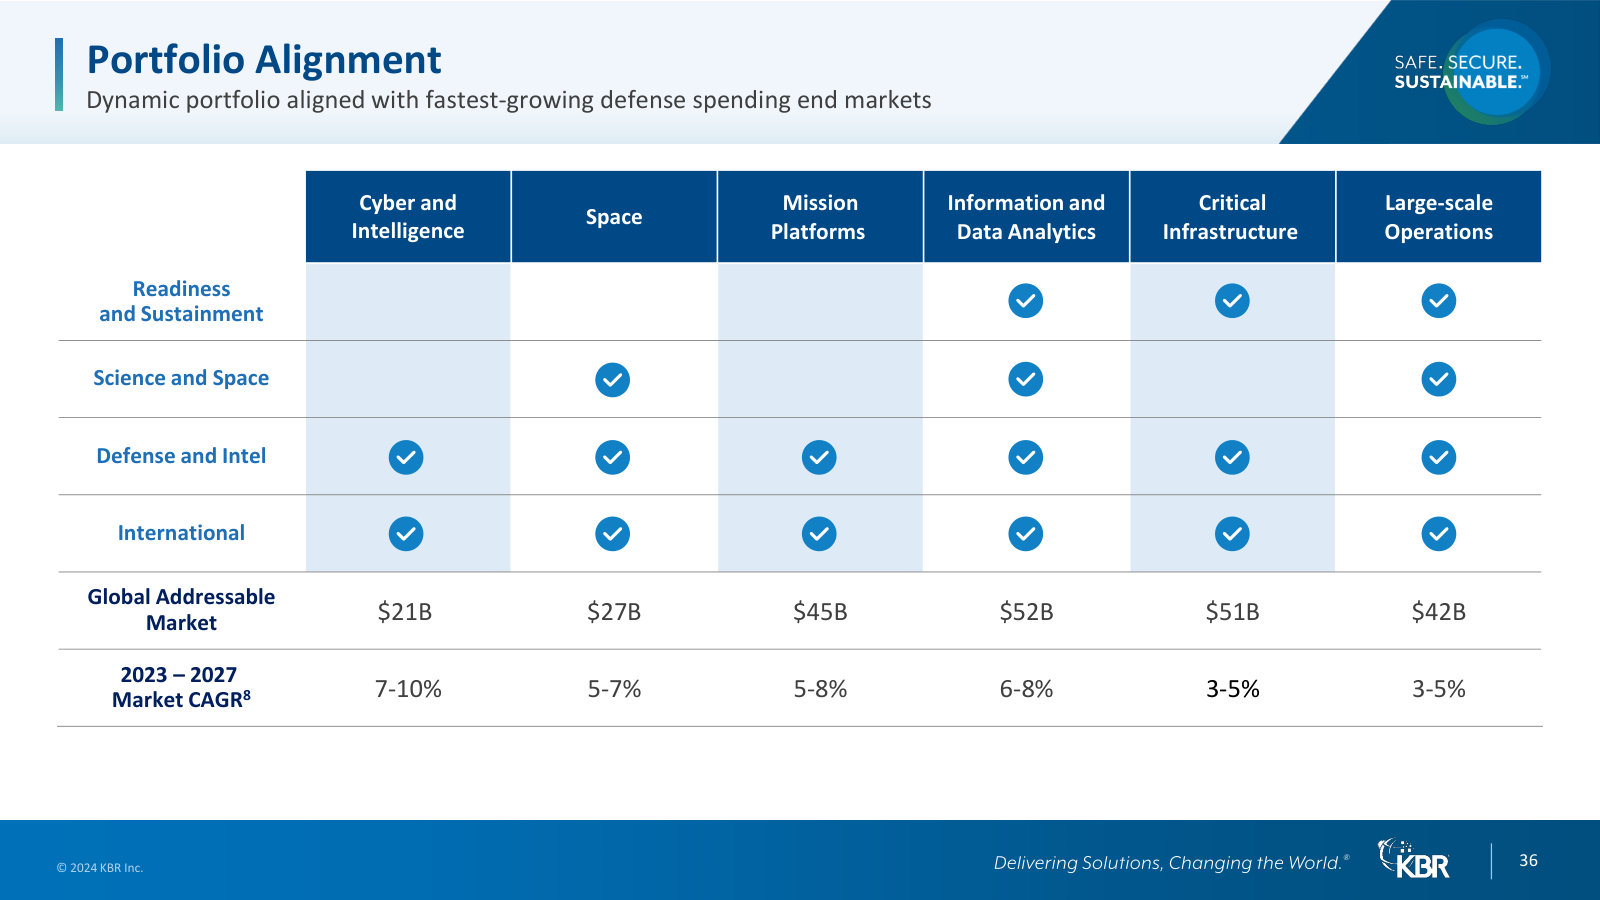
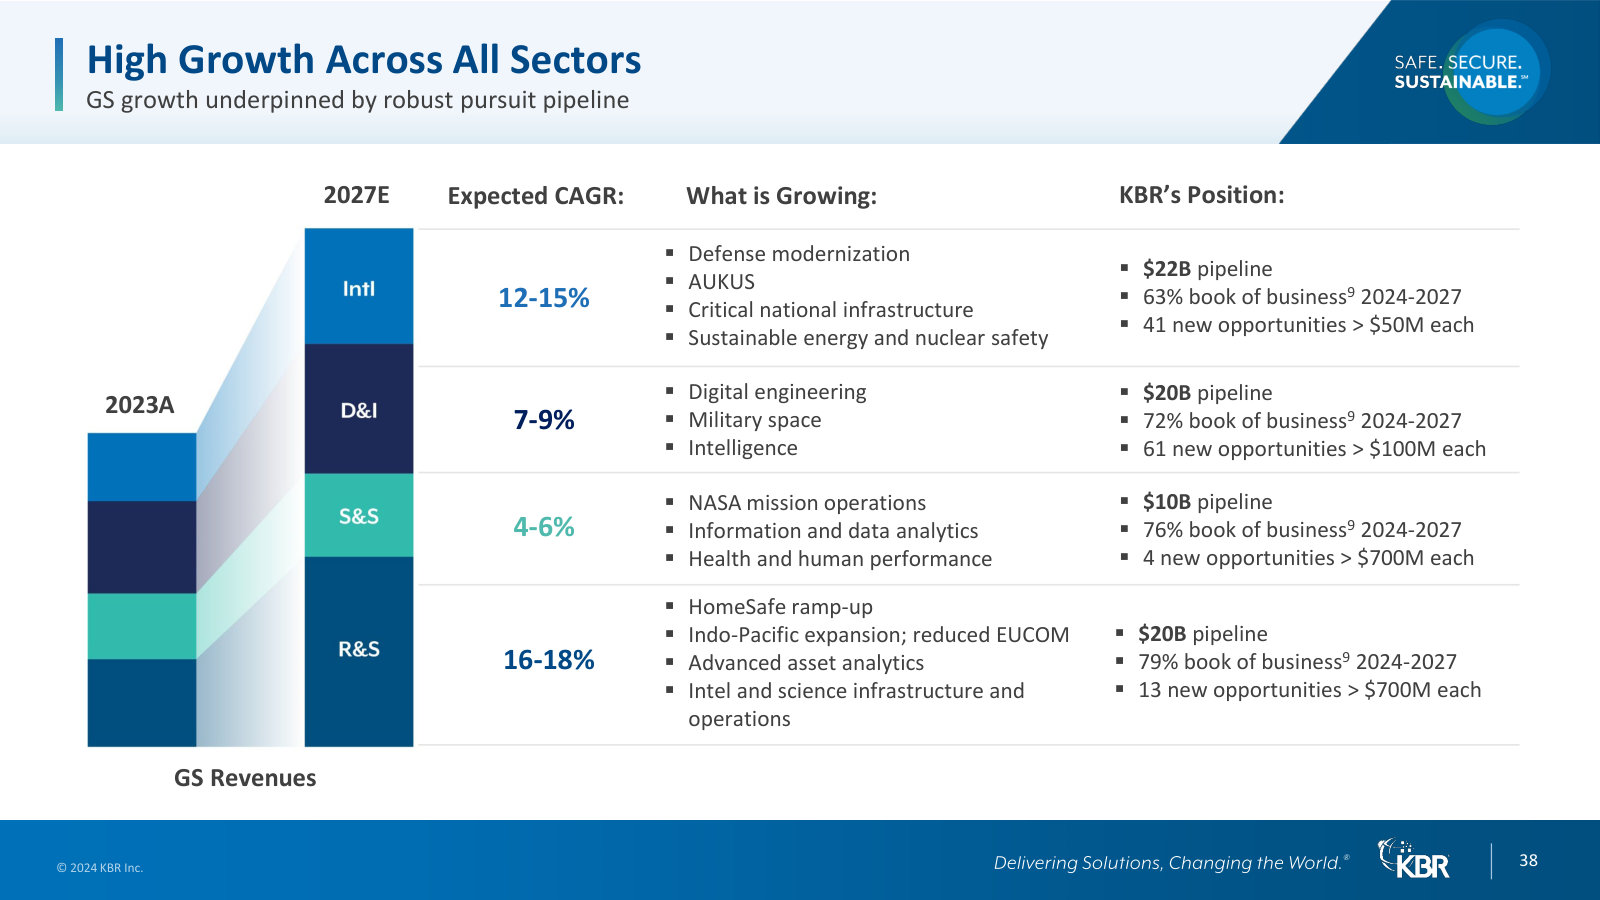
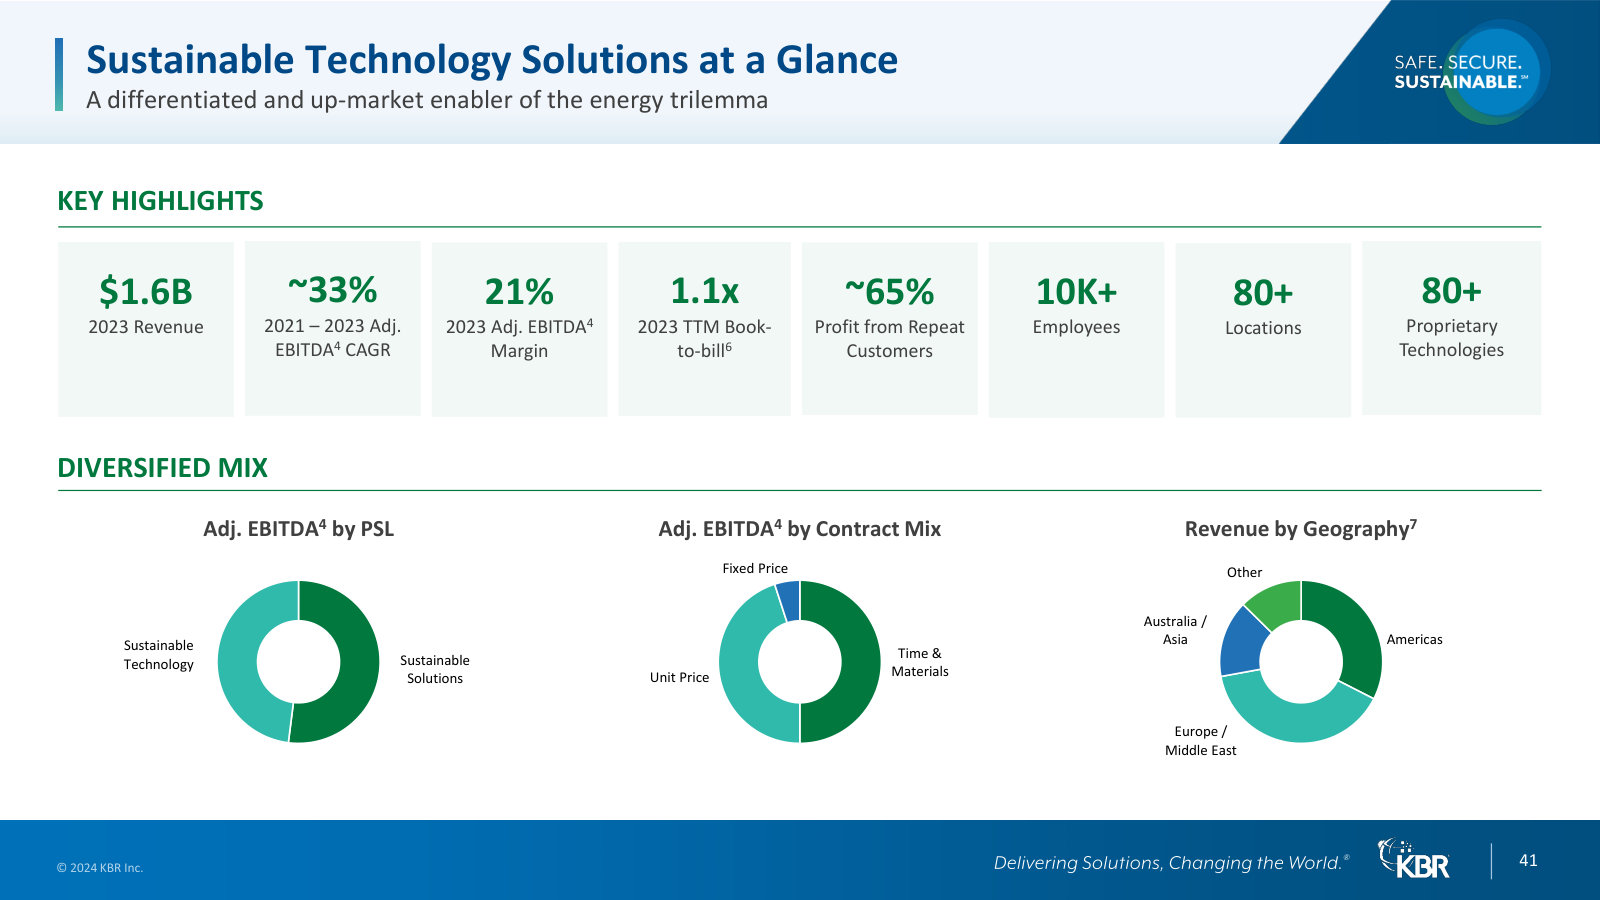
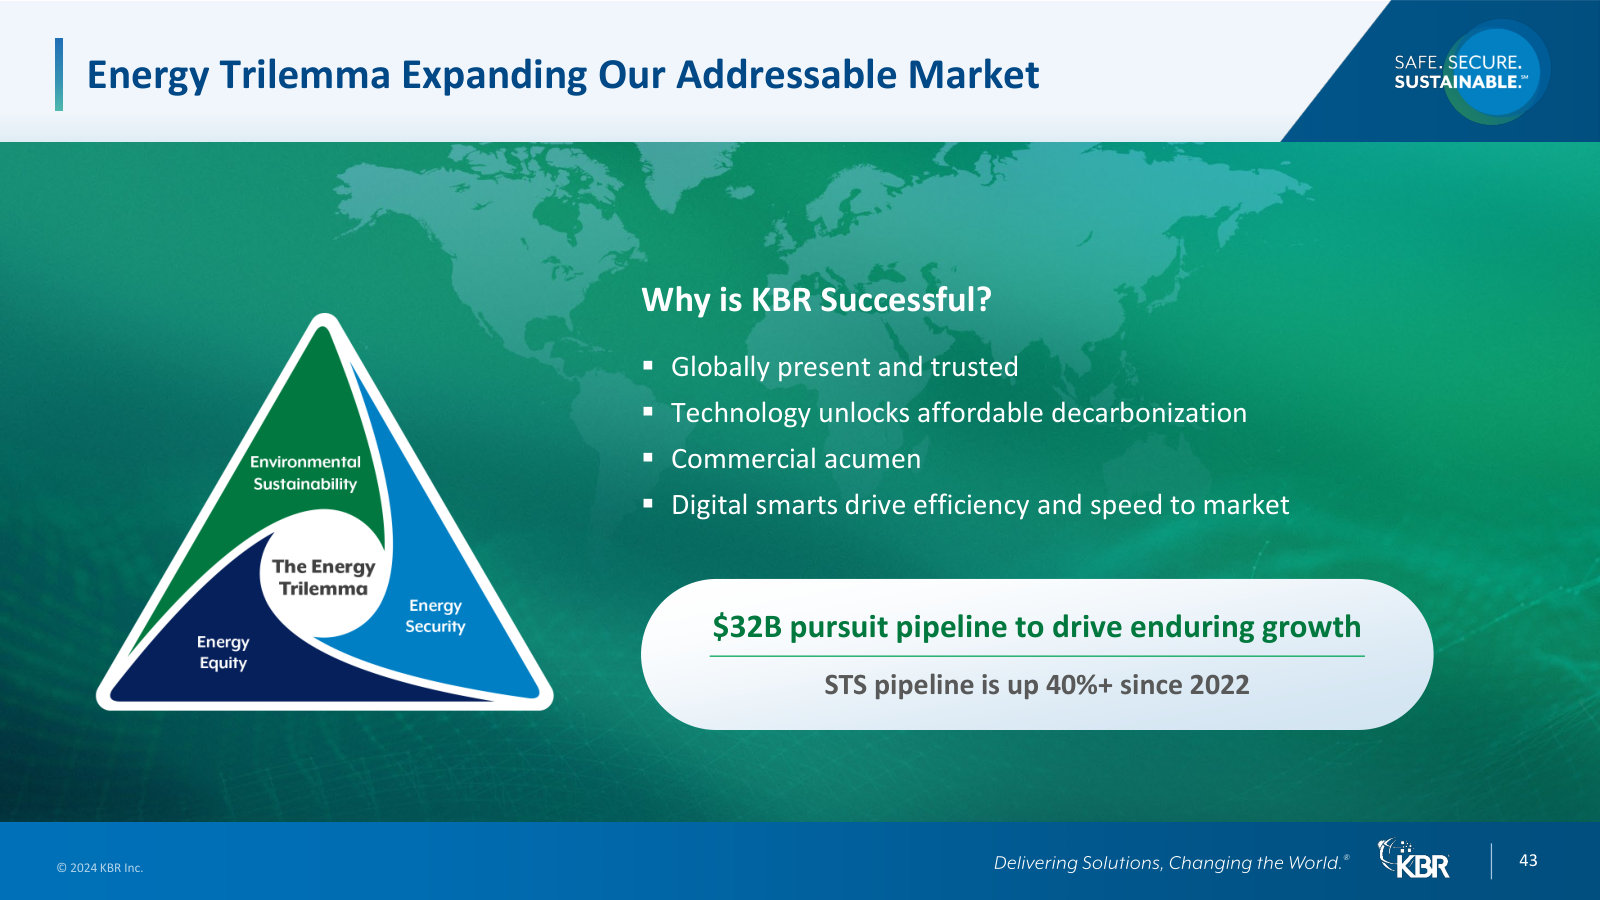
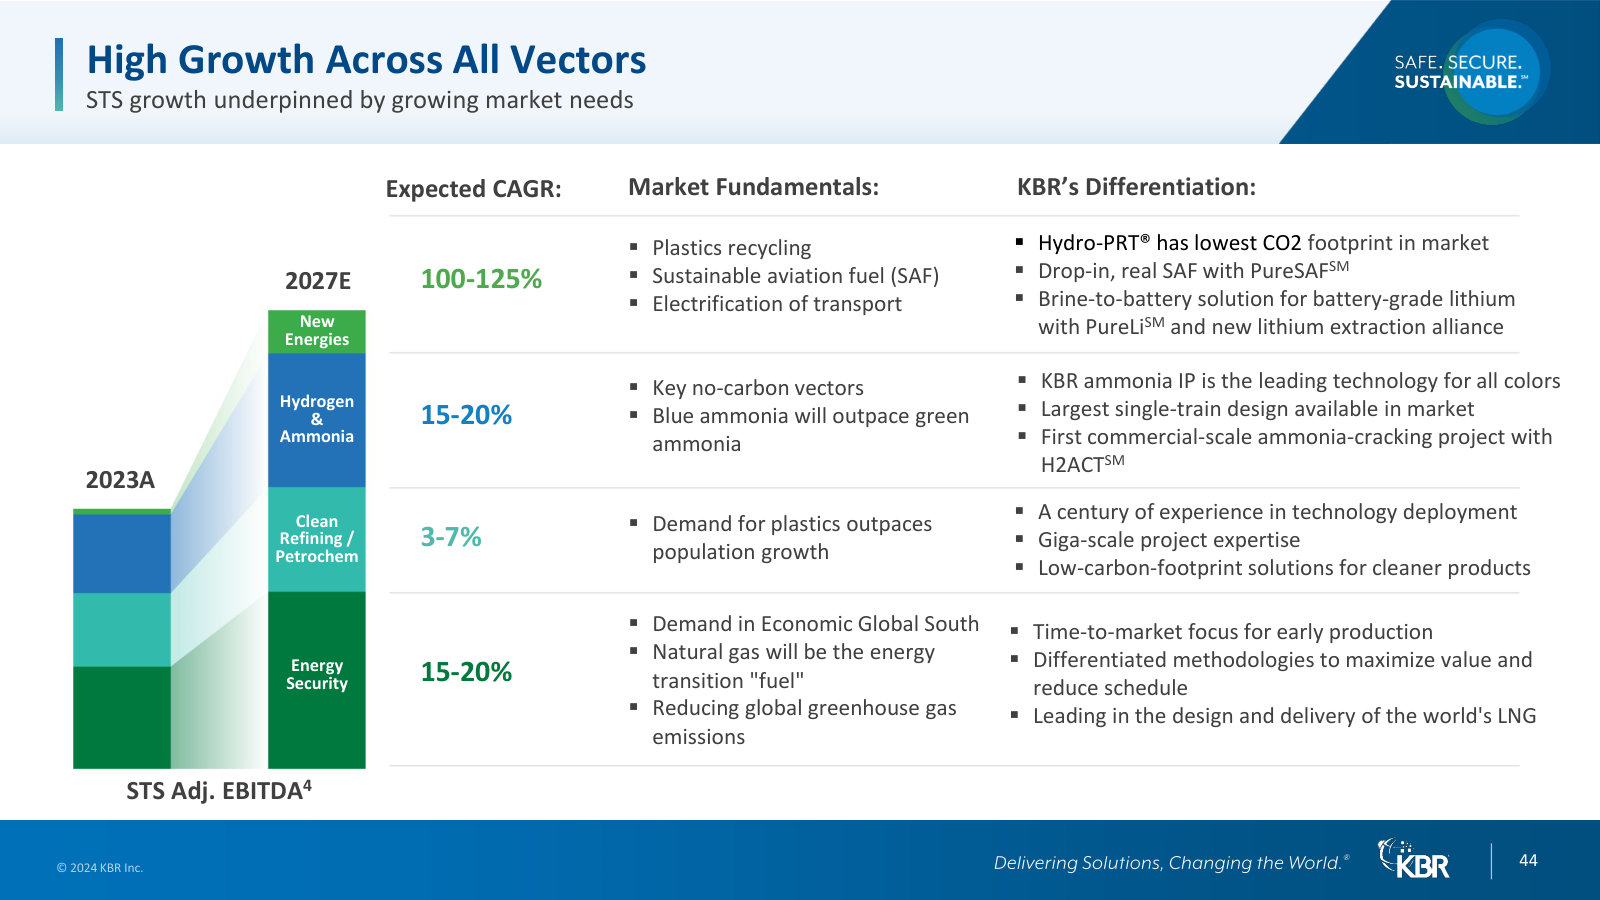
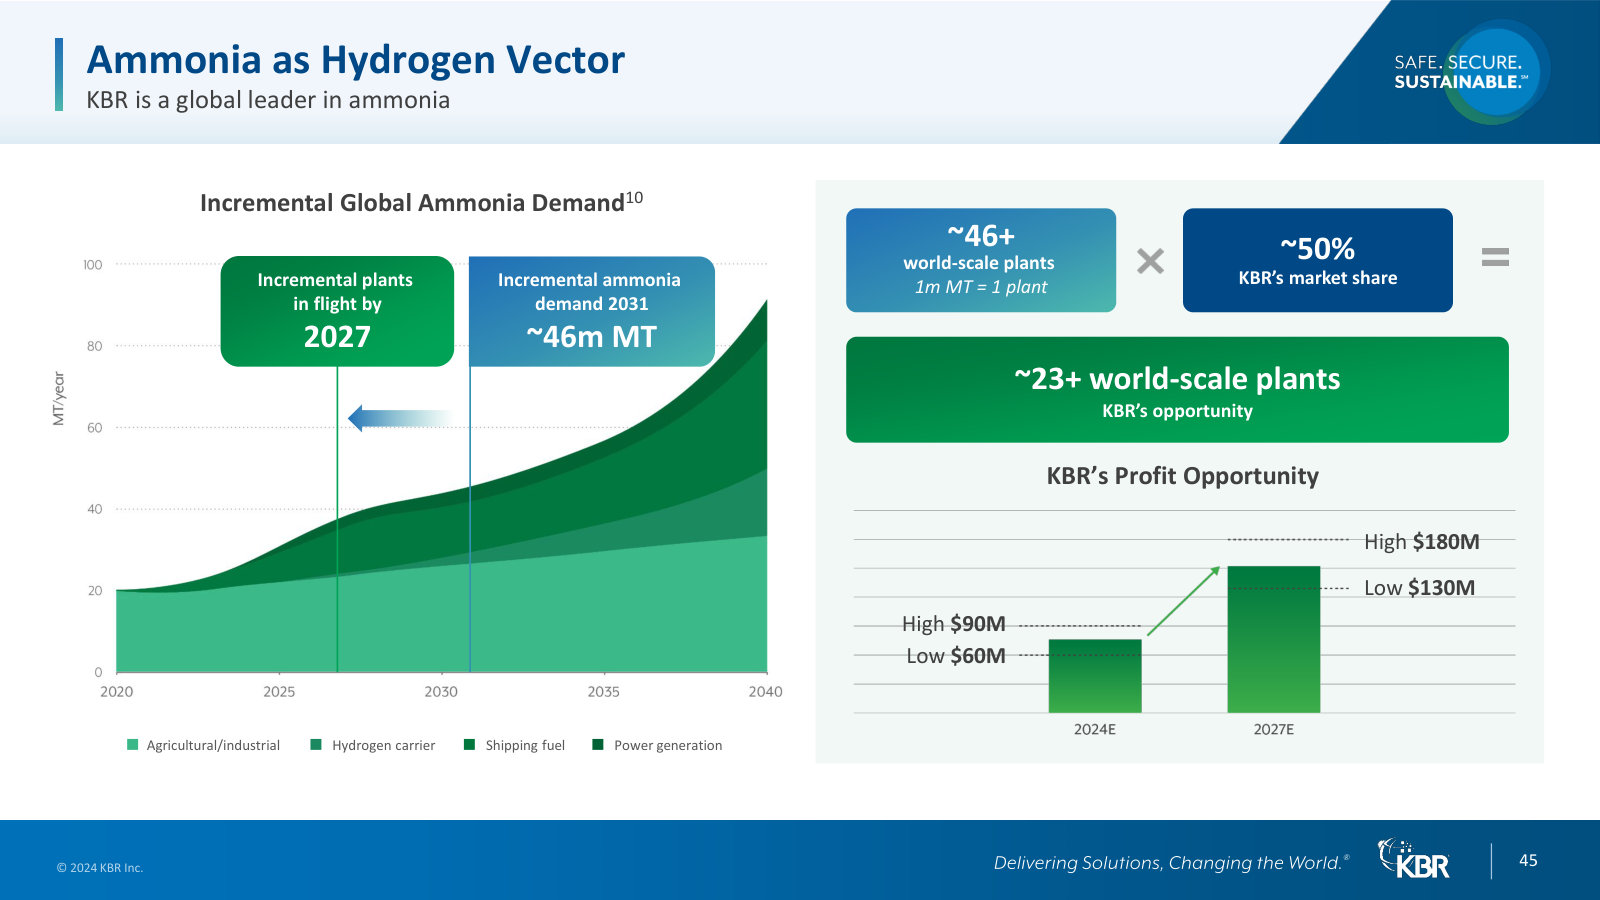
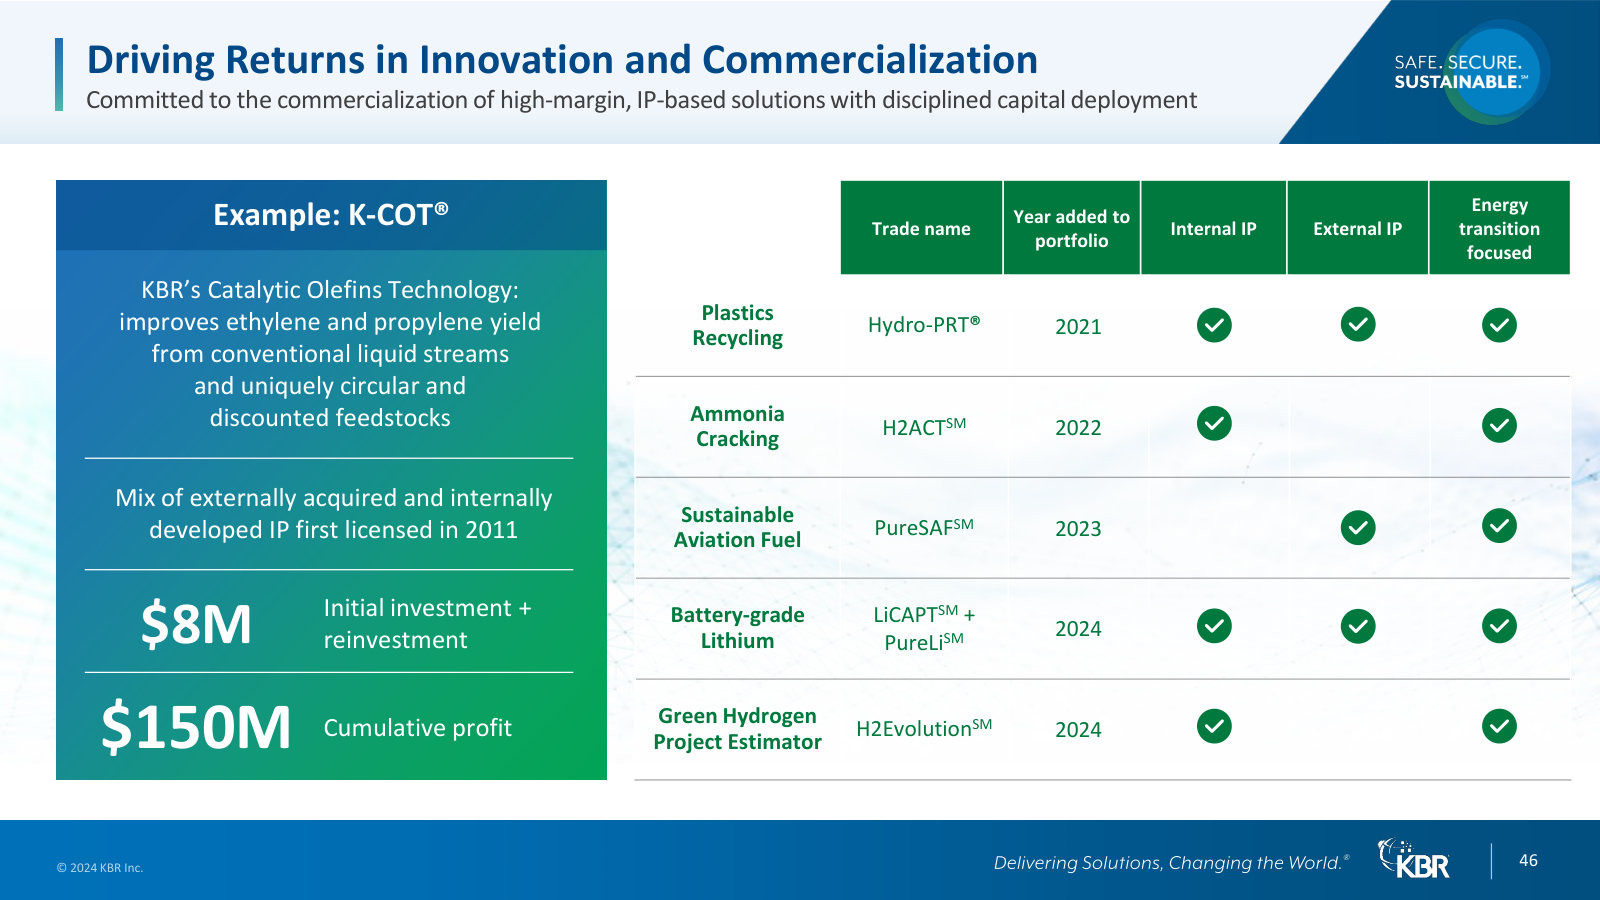
The fullest strategy deep-dive — end-market sizing, segment pipelines and IP economics. Predates the MTS/STS rename; targets since revised. · Open the full document →
More from management
1Q 2026 Earnings Presentation — 1Q2026 · 27 pages · The latest quarter, and the updated spin-off timeline — separation now expected to close January 4, 2027. · Open →
4Q & Full-Year 2024 Earnings Presentation — 4Q/FY2024 · 27 pages · The prior full-year baseline — FY2024 actuals and guidance, before the spin-off narrative began. · Open →
KBR, Inc.'s management answers for the business every quarter. These are the exchanges that explain it best — verbatim, from the call transcripts preserved in Sources. Each link opens the full transcript at that page in a new tab.
Q1 FY2026 Earnings Call — Q1 FY2026
The most recent call: how STS earns its margins, the base rate ex-LNG, the two-company spin, and sizing the NASA risk. · Open the full transcript →
How STS earns its margins: a tier from technology licensing down to JV-accessed domestic maintenance.
Chad Evans, EVP & CFO: As shown on the left, you can see the margin tiering across the STS portfolio. Higher margins are driven by technology licensing and differentiated engineering while international OpEx services, PMC and proprietary equipment fit in the middle. At the lower end is domestic maintenance, which we primarily access through our recurring JV structure, allowing us to participate with appropriately managed risks and returns. As shown on the right, that mix supports a 20%-plus weighted STS margin profile in 2026 driven by technology, engineering and JV participation.
p. 5 · Read in context →
Why KBR is splitting itself: two pure-play companies as the culmination of a decade-long transformation.
Stuart Bradie, President & CEO: The strategic rationale for the separation remains unchanged. This spin reflects the culmination of a decade-long portfolio transformation and will result in two independent pure-play companies with clear strategic focus, distinct investment profiles and dedicated leadership aligned to their end markets. As part of this process, we evaluated all strategic alternatives and concluded that a spin is the right path to unlock value and position both businesses for long-term success.
p. 4 · Read in context →
The base STS margin is ~15% ex the LNG JV, with technology and licensing mix the lever above 20%.
Stuart Bradie, President & CEO: In the quarter, excluding that project, we made 16.1% as Chad referenced. The circa 15% that we put in that slide generally is the mark for the base business as we look forward ex that LNG project. […] There are margin expansion opportunities on mix, particularly around technology, where margins in that part of the business can be well in excess of 20%. The more we do in licensing and earlier-stage engineering, the better for margins.
p. 7 · Read in context →
Sizing the NASA in-sourcing risk that management flagged: $50-60M at most this year, likely less.
Stuart Bradie, President & CEO: The main comment on NASA relates to the new administrator's push for greater in-sourcing — effectively moving contractor staff back onto government payroll. That is being discussed and is being evaluated today. We think that may or may not happen over the next little while, but if it does, it will be gradual. We called that out on the call. In terms of scale to KBR, it's on the order of $50 million to $60 million through the course of the year in the most conservative read, and likely a lesser impact than that in practice.
p. 7 · Read in context →
Q4 & Full-Year 2025 Earnings Call — Q4 FY2025
The annual call: 2025 proof points and record cash return, the quality-of-earnings case in both segments, and whether MTS could be sold rather than spun. · Open the full transcript →
2025 proof points: margins up 100+ bps, 110% cash conversion, a record $413M returned, LinQuest integrated and debt paid down.
Stuart Bradie, CEO: Operational execution was a clear strength in 2025. We expanded margins by more than 100 basis points and generated operating cash flow with a conversion rate of 110%, delivering over $30 million in cost savings and expect this margin and cash performance momentum to continue into 2026. And finally, deploy capital effectively. We delivered $413 million in capital to shareholders in the year, and that's the highest in the last decade, successfully integrated LinQuest and delevered the balance sheet within a year.
p. 2 · Read in context →
The STS quality-of-earnings case: EBITDA up 16% since 2023, outpacing revenue, on track for 20%-plus margins by 2027.
Chad Evans, CFO: That operating discipline is clearly showing up in the quality of earnings. Adjusted EBITDA has grown 16% since 2023, outpacing revenue growth and reflecting improved mix and cost execution. While margins were modestly elevated in 2025, we are on pace to meet our long-term margin target of 20% plus in 2027.
p. 4 · Read in context →
How MTS lifted margin quality: fixed-price, technically differentiated work chosen for returns, not volume.
Chad Evans, CFO: Since 2023, the integration of LinQuest, strong international execution, and a more selective business development approach have supported mid-single-digit revenue growth while improving margin quality. Importantly, that improvement has been driven by commercial acumen and contract discipline, including a greater focus on fixed price and technically differentiated work, not volume. Even with near-term headwinds from award timing and process activity, the team remained highly selective in bids and recompetes, prioritizing returns and contract terms over scale.
p. 4 · Read in context →
Pressed on whether MTS could be sold instead of spun, Bradie will not rule out any value-enhancing approach.
Sangita Jain (KeyBanc); Stuart Bradie, CEO: My first one is, are you still exploring a sale of that segment? Can you speak to the process if you are? And is that still an option as you move towards the split? […] I cannot answer that question. However, we are committed to shareholder value, and that is absolutely true. We are currently going through this spin process to demonstrate our commitment. We are open to any approaches that could enhance shareholder value.
p. 8 · Read in context →
Q3 FY2025 Earnings Call — Q3 FY2025
The call after the September spin announcement: the transaction laid out, the shutdown-resilience thesis, how STS technology revenue and backlog actually work, and whether buyers have circled. · Open the full transcript →
The spin, laid out: Mission Technologies becomes 'SpinCo,' New KBR keeps Sustainable Tech, two tax-free pure-play companies.
Stuart Bradie, CEO: Before the key takeaways, I will give you an update on the spin off, which was previously announced on September 24. We are spinning off our Mission Technologies segment, which I will refer to as SpinCo for now until a new name is announce later. New KBR will comprise the Sustainable Technology Solutions business. Our intent is to pursue this as a tax-free spin and upon completion of which KBR and its shareholders will benefit from ownership in two pure-play public companies with enhanced strategic focus, operational independence, and financial flexibility.
p. 4 · Read in context →
Why a U.S. government shutdown barely dents KBR: ~40% of revenue and 60%+ of EBITDA have zero federal-budget exposure.
Stuart Bradie, CEO: we'll remind you that circa 40% of KBR's group revenue and over 60% of adjusted EBITDA has zero exposure to the U.S. government spending budgets and of course, risk related to the shutdown. Within MTS U.S., the majority of our portfolio, as we've discussed many times, is comprised of mission essential operational work, many of which are well-funded multiyear programs. This provides short-term resilience to the government shutdown
p. 1 · Read in context →
How STS technology revenue breaks down: license fee, basic engineering, and lower-margin proprietary equipment, blended over time.
Stuart Bradie, CEO: Mark mentioned in his prepared remarks that this quarter we saw a significant amount of proprietary equipment reflected in the revenue. As we've discussed before, our technology sales consist of the license fee, basic engineering, and proprietary equipment. The overall combined margins align with our typical expectations; however, the proprietary equipment has a lower margin and there was an increase in that this quarter.
p. 9 · Read in context →
Why KBR reports STS backlog as a 6-8 month near-term figure rather than a headline total.
Stuart Bradie, CEO: If we looked at long-term backlog, the number would be so big that you wouldn't believe it, and rightly so because some of these projects go away. It's far better that we concentrate on what's real. For us, that sort of $5 billion or so in near-term backlog, which is 6 to 8 months.
p. 10 · Read in context →
Asked whether outside buyers have approached since the spin news, Bradie acknowledges inbounds but will not discuss them.
Tobey Sommer (Truist); Stuart Bradie, CEO: Could you tell us if you've received any interest from outside parties in acquiring either of the businesses since announcing the spin? […] Tobey, you know I can't answer that question. I'm sorry. I cannot answer that question. The thing that we have announced is going well in terms of under Mark's tutelage and is progressing as expected and on track. It is typical, I would say, that once you announce such things that you do get inbounds, but we are not at liberty to discuss them in any way, shape, or form, I'm sorry.
p. 8 · Read in context →
Q2 FY2024 Earnings Call — Q2 FY2024
Where the current shape was set: the LinQuest move into higher-end space and defense tech, the plan to collapse to two segments, and the ammonia technology moat. · Open the full transcript →
The LinQuest deal: 1,500 people in Space Force, JADC2 and national-security space, complementary with little overlap and double-digit margins.
Stuart Bradie, CEO: LinQuest has over 1,500 people. They do amazing work across National Security Space—think Space Force, Future Air Dominance, the Air Force, and JADC 2—and connected battlespace, meaning interoperability and digital. Their capability is highly complementary to KBR’s with little overlap, which I think gives exciting synergy opportunities. We've highlighted how those work on the slide. We're also excited about the fact that they have double-digit margins as well as a robust presynergy growth profile, which is terrific.
p. 3 · Read in context →
Foreshadowing the two-segment structure: collapse three units to two, managed globally to cut complexity and capture synergies.
Stuart Bradie, CEO: Following these points from Investor Day, with LinQuest as a catalyst, we believe there are opportunities to realign our business to operate even better based on our capabilities and markets. The objective of this realignment will be to reduce complexity, realize synergies like AUKUS and One Saudi as we presented at Investor Day. We will likely manage both segments globally to allow for greater standardization and business process optimization, which should drive efficiency. We will work on this through the remainder of 2024 and expect to report results along these lines in full year 2025. To be clear, the segments and enterprise targets for 2027 will remain intact through this realignment.
p. 4 · Read in context →
How the realignment reshuffles work: the Diriyah Gate mega-project moves from Government into Sustainable Tech.
Stuart Bradie, CEO: We'll move from three business units to two effectively with bits of what we've been describing as GSI. I'll give you a good example: The Diriyah Gate project, which is a full-on project management of a new sustainable city in Saudi Arabia, currently sits in the government segment but could—given its commercial contractual basis, its program management at scale, and its location—realize our One Saudi vision by leveraging our position across our broader customer base. That sort of project will move into STS going forward.
p. 4 · Read in context →
STS's technology moat: the only two blue-ammonia projects worldwide to reach FID both run on KBR's proprietary process technology.
Stuart Bradie, CEO: In fact, there are only two blue ammonia projects in the world that have reached final investment decision, and both are using KBR's technology. These are the OCI plant in Bowman, Texas, and Fertiglobes in the UAE, which will make KBR's proprietary process technology the first to produce blue ammonia. This, in addition to our industry position in green ammonia, puts us in a very strong position.
p. 2 · Read in context →
More calls
Q2 FY2025 Earnings Call — Q2 FY2025 · 10 pages · For the mid-2025 picture under the new MTS/STS segments: tariff and Middle East headwinds, EUCOM step-down, and $21.6B backlog. · Open →
Q1 FY2025 Earnings Call — Q1 FY2025 · 11 pages · The first quarter reported under the new Mission Tech / Sustainable Tech segments, with record backlog going into the year. · Open →
Q4 & Full-Year 2024 Earnings Call — Q4 FY2024 · 14 pages · The FY2024 annual: the segment realignment completed, first full-year view with LinQuest, and ~$21B backlog. · Open →
Q3 FY2024 Earnings Call — Q3 FY2024 · 8 pages · LinQuest's first quarter inside KBR: integration progress and its lift to the Defense & Intelligence business. · Open →
Q1 FY2024 Earnings Call — Q1 FY2024 · 8 pages · The pre-transformation baseline: KBR before LinQuest and before the two-segment realignment, under the old Government Solutions structure. · Open →
KBR, Inc.'s annual reports contain management's most considered account of the business. These are the sections, passages and visual pages worth opening in the originals preserved in Sources.
KBR, Inc. — Fiscal 2025 Annual Report (Form 10-K) — Fiscal 2025 (year ended Jan 2, 2026)
The year KBR recast itself: it renamed Government Solutions to Mission Technology Solutions and moved to spin it off into a separate public company. · Open the full document →
Item 1. Business — Company Overview — p. 12 · Read the full section →
How management defines KBR and its shift toward technology-driven, higher-return solutions for governments and commercial clients.
What KBR is and the operating-model shift management is steering in fiscal 2025.
KBR, Inc., a Delaware corporation ("KBR" or, the "Company"), delivers science, technology, engineering and logistics support solutions to the U.S. federal government, allied nations and commercial clients around the world. […] In the fiscal year ended January 2, 2026 ("fiscal 2025"), KBR’s operating model continued to shift toward agile, technology-driven, solutions-oriented delivery and was streamlined to increase strategic focus and to move upmarket into differentiated areas that we believe will provide attractive returns and consistent growth with favorable cash conversion.
p. 12 · Read in context →
Item 1. Business — Our Business Segments — p. 16 · Read the full section →
The two engines of revenue: defense/space mission services (MTS) and 85+ proprietary sustainability process technologies (STS).
The two core segments — Mission Technology Solutions and Sustainable Technology Solutions — in management's words.
Mission Technology Solutions. Our Mission Technology Solutions business segment provides full life-cycle support solutions to defense, intelligence, space, aviation and other programs and missions for military and other government agencies primarily in the U.S., U.K. and Australia. […] Sustainable Technology Solutions. Our Sustainable Technology Solutions business segment is anchored by our portfolio of over 85 innovative, proprietary, sustainability-focused process technologies that reduce emissions, increase efficiency and/or accelerate and enable energy transition across the industrial base in four primary verticals: ammonia/syngas, chemical/petrochemicals, clean refining and circular process/circular economy solutions.
p. 16 · Read in context →
Item 1. Business — Mission Technology Solutions Spin-off — p. 18 · Read the full section →
The defining strategic event: KBR intends to split its largest segment into a standalone public company, targeted for 2H fiscal 2026.
The planned tax-free spin-off of Mission Technology Solutions.
In September 2025, we announced our intention to spin off our Mission Technology Solutions business into a separate, U.S. publicly-traded company (the "Planned Spin-Off"). The Planned Spin-Off is intended to be tax-free to us and our shareholders for U.S. federal income tax purposes and targeting completion in the second half of the fiscal year ended January 1, 2027 ("fiscal 2026"). The spin-off will be subject to final approval by our Board of Directors and other customary conditions, including receipt of a favorable opinion of legal counsel and/or a private letter ruling from the U.S. Internal Revenue Service with respect to the tax treatment of the transaction for U.S. federal income tax purposes, the effectiveness of a registration statement on Form 10 filed with the SEC, satisfactory completion of financing and other regulatory approvals. Because the intended transaction is a spin-off, the Mission Technology Solutions business is not classified as held for sale and will be reported as continuing operations.
p. 18 · Read in context →
Item 1A. Risk Factors — p. 47 · Read the full section →
The two risks most specific to KBR: executing the spin-off, and dependence on government budgets — U.S. agencies alone are ~57% of revenue.
Revenue concentration in government spending that customers can modify or terminate at will.
Demand for our services provided under government contracts is directly affected by spending by our customers. […] We derive a significant portion of our revenues from contracts with agencies and departments of the U.S., the U.K. and Australia governments, which is directly affected by changes in government spending priorities and availability of adequate funding. […] The loss of work we perform for governments or decreases in governmental spending and outsourcing could have a material adverse effect on our business, results of operations and cash flows.
p. 55 · Read in context →
Item 7. MD&A — Results of Operations — p. 82 · Read the full section →
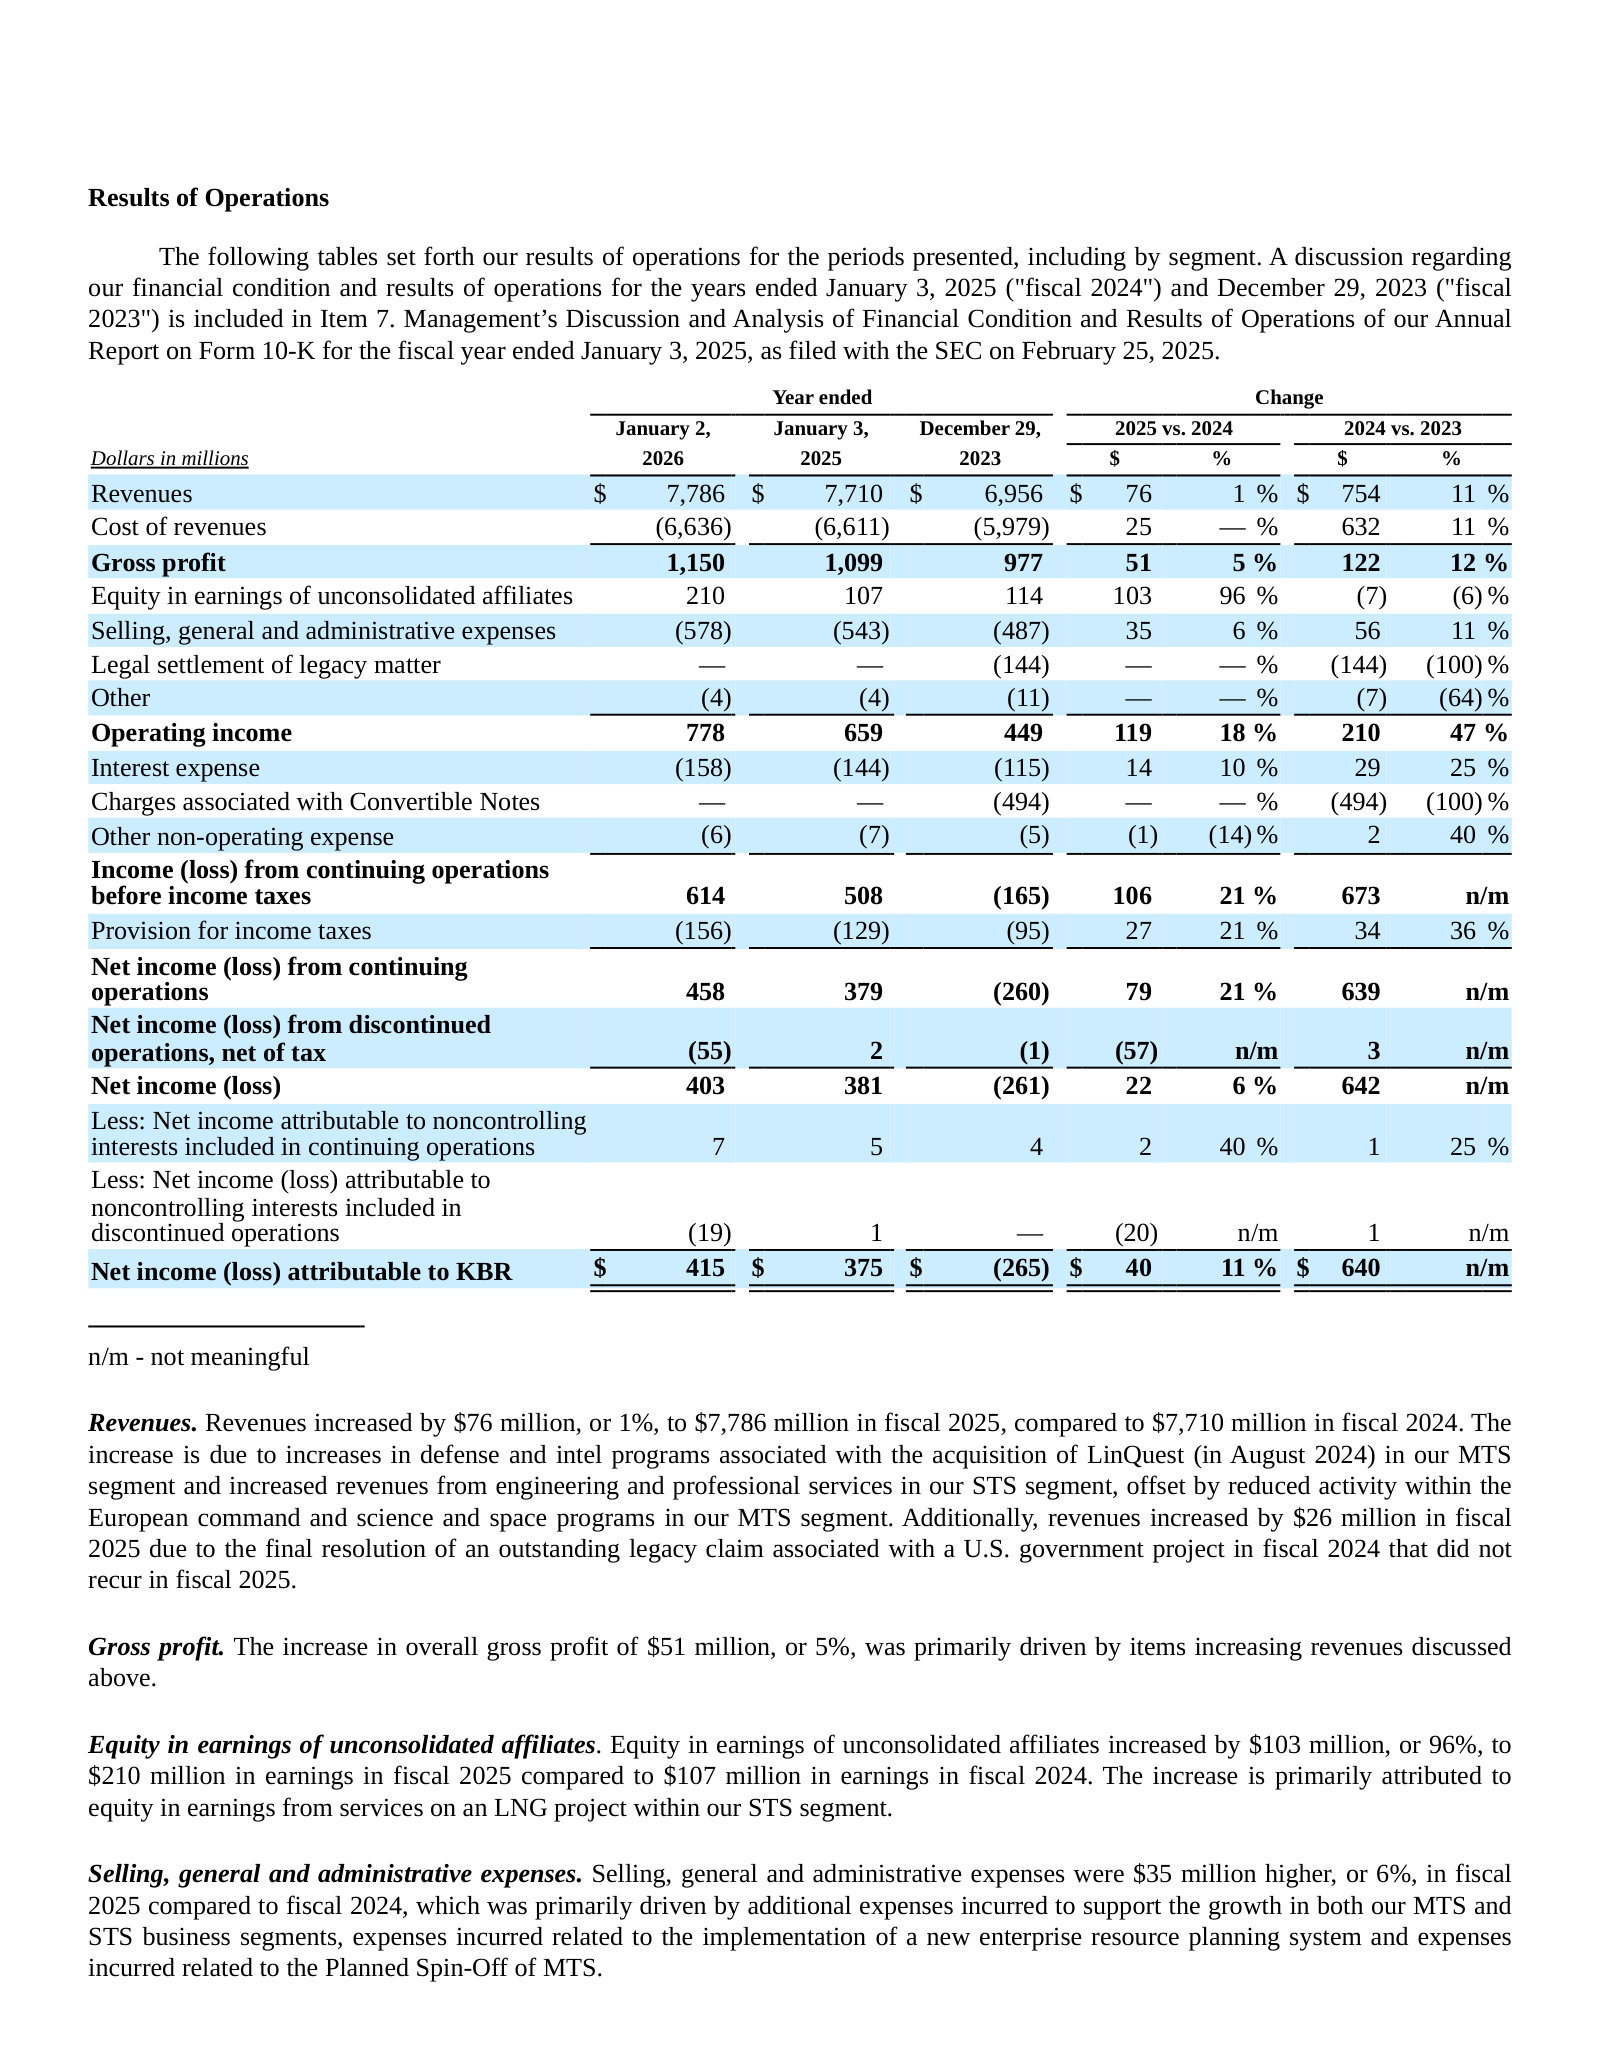
Revenue up 1% to $7,786M yet operating income up 18% to $778M — the margin and equity-earnings story management tells for fiscal 2025.
Item 7. MD&A — Results of Operations by Business Segment — p. 85 · Read the full section →
Segment economics: MTS $5,581M revenue / $463M operating income, STS $2,205M / $477M — STS the smaller, higher-margin engine.
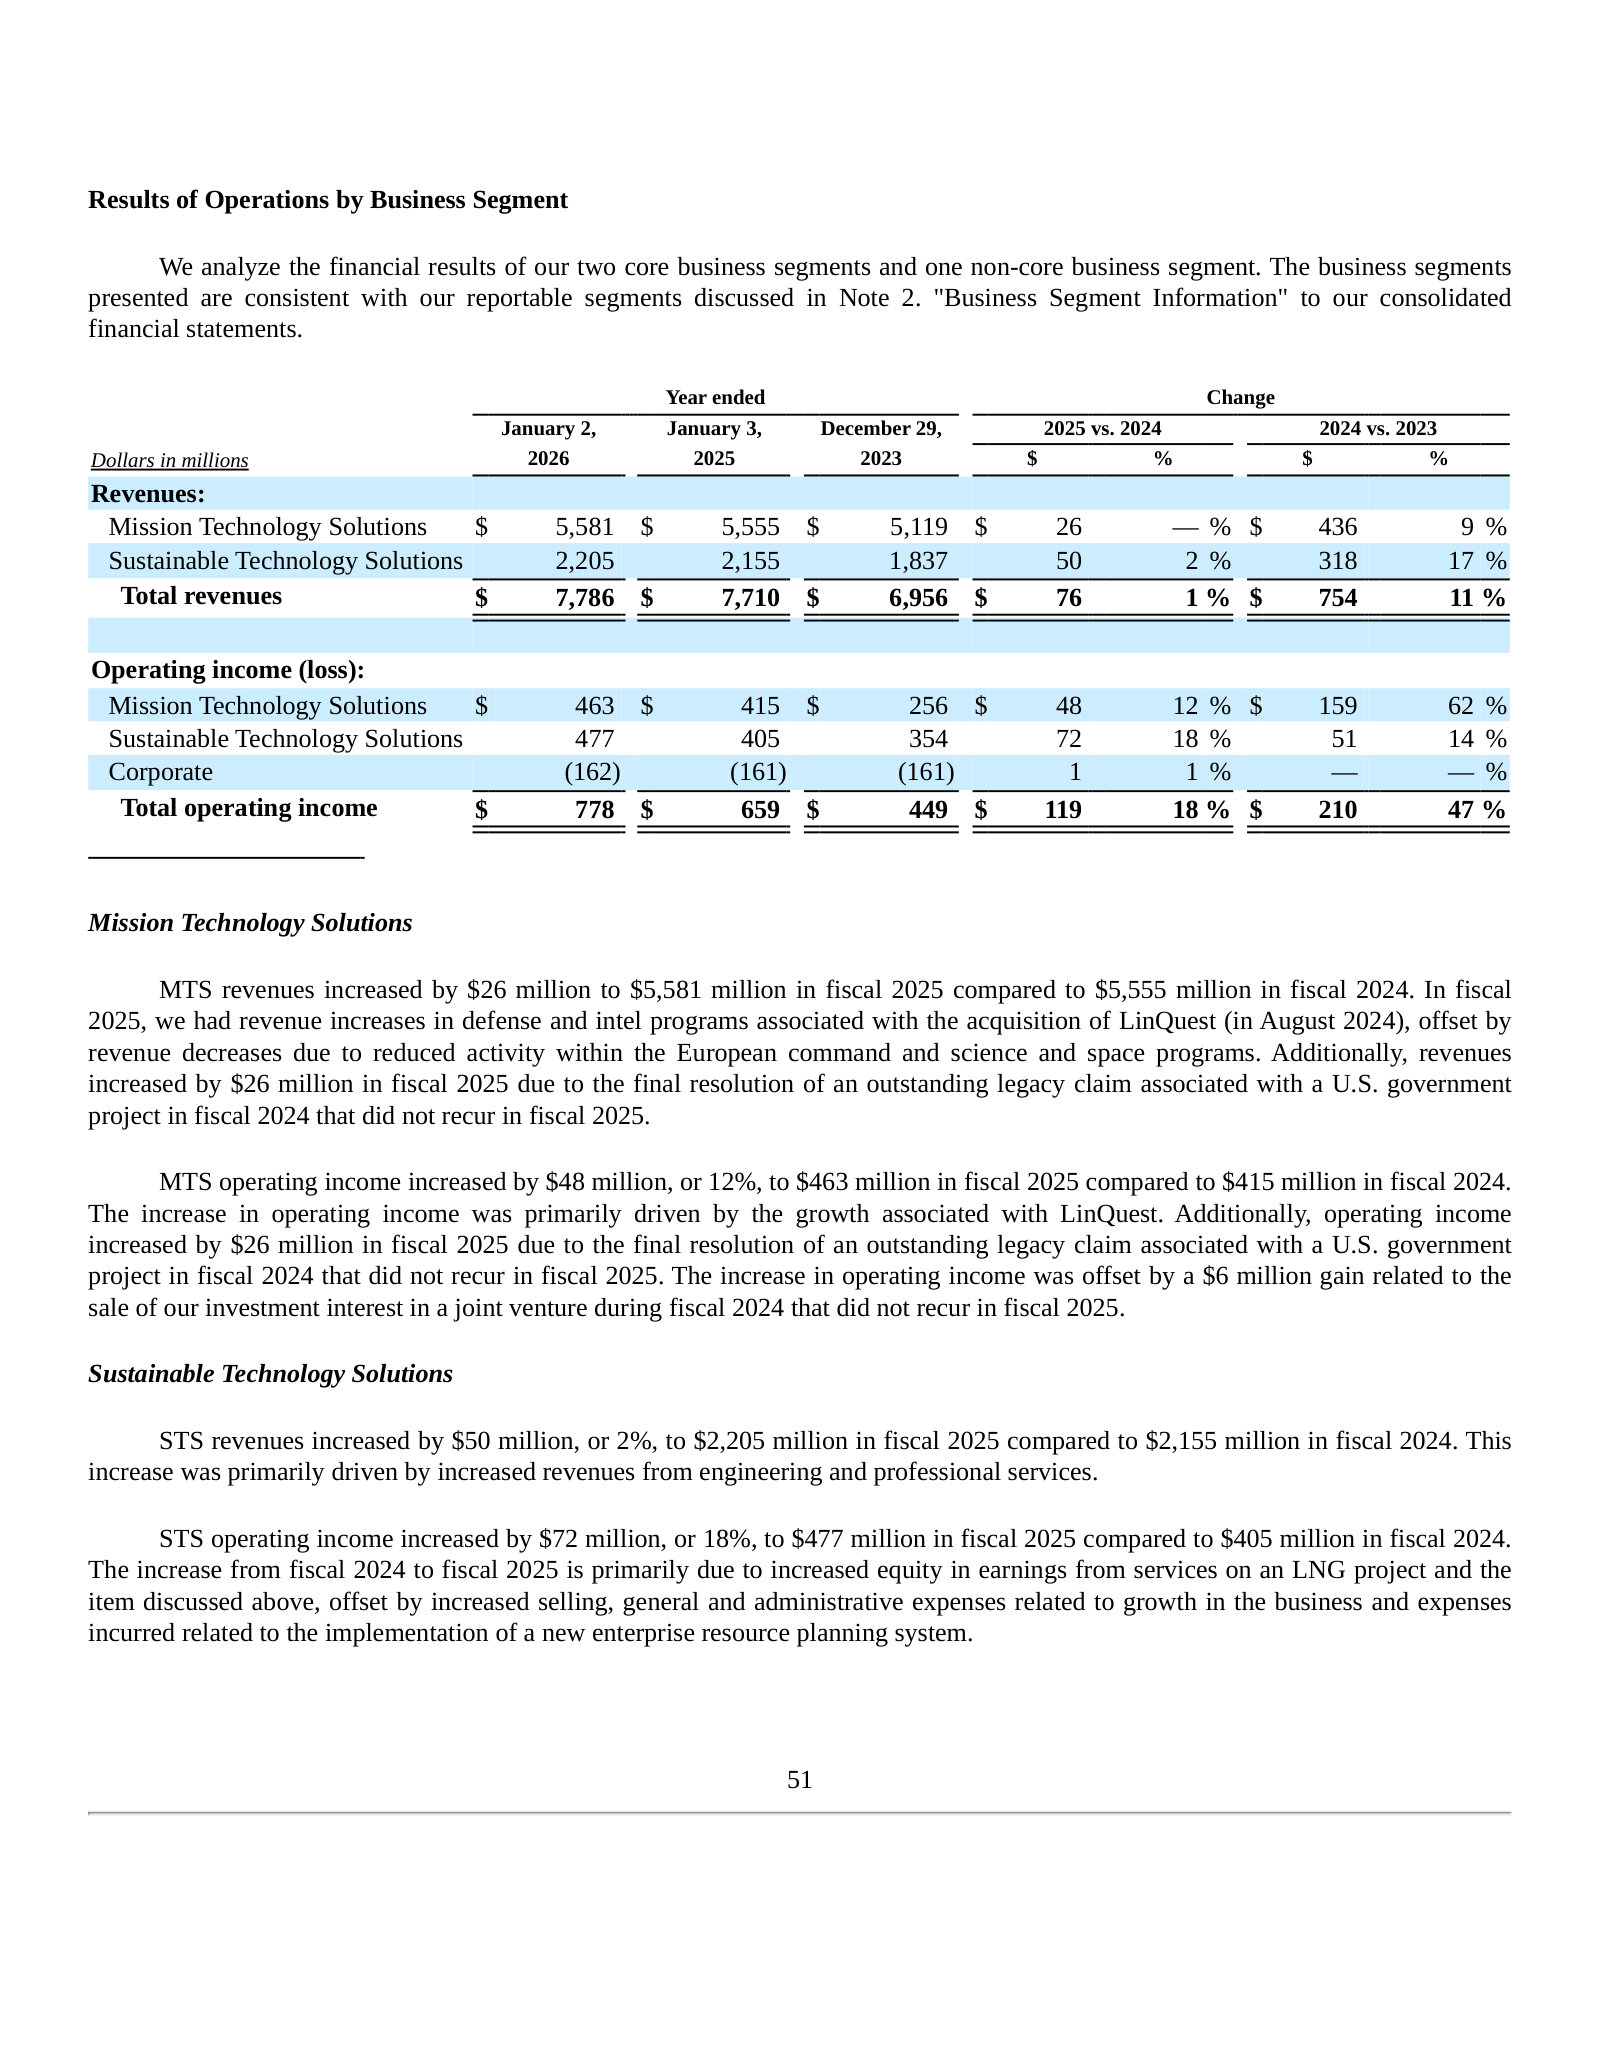
What actually moved MTS revenue — LinQuest offset by European command and space program declines.
MTS revenues increased by $26 million to $5,581 million in fiscal 2025 compared to $5,555 million in fiscal 2024. In fiscal 2025, we had revenue increases in defense and intel programs associated with the acquisition of LinQuest (in August 2024), offset by revenue decreases due to reduced activity within the European command and science and space programs.
p. 85 · Read in context →
Item 7. MD&A — Critical Accounting Policies and Estimates — p. 97 · Read the full section →
The policy that defines a contractor's earnings: over-time revenue on the cost-to-cost method, driven by cost-to-complete estimates.
KBR, Inc. — Fiscal 2024 Annual Report (Form 10-K) — Fiscal 2024 (year ended Jan 3, 2025)
Included to show the segment before the recast: the same defense/space business was reported as 'Government Solutions,' a year before the rename and planned spin-off. · Open the full document →
Item 1. Business — Our Business Segments — p. 14 · Read the full section →
The prior-year name for today's Mission Technology Solutions — evidence of the fiscal-2025 rebrand and reorganization.
The segment reported as 'Government Solutions' in fiscal 2024, later renamed Mission Technology Solutions.
Government Solutions. Our Government Solutions business segment provides full life-cycle support solutions to defense, intelligence, space, aviation and other programs and missions for military and other government agencies primarily in the U.S., U.K. and Australia.
p. 14 · Read in context →
More annual reports
KBR, Inc. — Fiscal 2023 Annual Report (Form 10-K) — Fiscal 2023 (year ended Dec 29, 2023) · 142 pages · Pre-LinQuest, pre-spin-off baseline: $6,956M revenue with the legacy legal settlement and convertible-note charges booked that year. · Open →
KBR, Inc. — Fiscal 2022 Annual Report (Form 10-K) — Fiscal 2022 (year ended Dec 31, 2022) · 160 pages · Earlier Government Solutions / Sustainable Technology Solutions structure for multi-year trend comparison. · Open →
KBR, Inc. — Fiscal 2021 Annual Report (Form 10-K) — Fiscal 2021 (year ended Dec 31, 2021) · 181 pages · The earliest edition on hand, useful for tracing the pivot from legacy E&C toward government and technology services. · Open →
Competitors describe KBR, Inc.'s market in their own filings and calls. These verified passages and visual pages show where their strategies meet, using source documents preserved in Sources.
Leidos Holdings, Inc. (LDOS)
The largest U.S. government-services and defense-technology contractor, and KBR's most direct rival across defense systems, space, intelligence and IT modernization. Leidos names KBR by name in its 10-K competitor list.
Leidos's FY2025 10-K lists KBR among its named principal competitors across systems integration and defense engineering/technical services.
Our principal competitors currently include the following companies: Accenture Federal Services LLC, Amentum Services Inc., KBR, Inc., BAE Systems, Booz Allen Hamilton Inc., CACI International Inc., Deloitte, General Dynamics Corporation, GovCIO, IBM, KBR Inc., L3Harris Technologies, Inc., Lockheed Martin Corporation, ManTech, Northrop Grumman Corporation, Optum, Parsons Corporation, Peraton Inc., RTX Corporation and SAIC.
p. 11 · Read in context →
Leidos's CEO describes a defense-systems growth pivot spanning U.S., U.K. and Australia government programs — the international government footprint KBR also serves.
Thomas A. Bell (Chief Executive Officer): we're very bullish on our opportunity to help this administration increase the size and lethality of the U.S. Navy. And I'm very proud that both in Australia and the U.K., we have corollary unmanned autonomous vehicle programs that have synergy with what we're doing here in the U.S. So all in all, we see a tremendous pivot for our defense business […] now really pivoting to LRIP and programs of record, which has always been our plan since we acquired our defense tech business some years ago.
p. 5 · Read in context →
Leidos points to expanded NASA ARTEMIS space-program work and an international air-traffic-management win among recent government awards.
Thomas A. Bell (Chief Executive Officer): We are expanding our contribution under an asset contract to support the ARTEMIS program in long-duration space exploration. And we received a large award to modernize Kazakhstan's air traffic control system using our Skyline X comprehensive air traffic management system.
p. 1 · Read in context →
Science Applications International Corporation (SAIC)
A pure-play U.S. government technology integrator in defense, space, intelligence and civilian IT modernization — the closest listed analog to KBR's Government Solutions mission-IT and digital-engineering work.
SAIC frames its served market as the full-lifecycle U.S. government technical/engineering/IT space and sizes its footprint at roughly 1,700 active contracts and 23,000 employees.
As one of the largest pure-play technology service providers to the U.S. government, we serve markets of significant scale and opportunity. Our primary customers are the departments and agencies of the U.S. government. […] We serve our customers through approximately 1,700 active contracts and task orders and employ approximately 23,000 individuals
p. 45 · Read in context →
SAIC's CFO acknowledges nontraditional commercial entrants in the government market and defends SAIC's differentiated role as a “mission integrator.”
Prabu Natarajan (Chief Financial Officer): we are seeing new entrants in the market, nontraditional, with more commercial orientation to them. […] we welcome newcomers in the industry as a mission integrator. I think we believe sincerely that the offerings from commercial vendors still will require mission integration at its core to be able to operate inside of the government environment. So we welcome the competition in the industrial base.
p. 4 · Read in context →
SAIC discloses new-business win rates approaching 50% and recompete win rates of roughly 85–90% in its differentiated engineering and mission-IT work.
Prabhu Natarajan (Chief Financial Officer): our win rates on non-enterprise IT work—some of the work we do on the engineering side as well as the mission IT side—our win rates on new have approached 50% or more at various points over the last couple of years. […] our recompete win rates on non-commoditized enterprise IT is sort of in that 85% to 90% range. So good win rates outside of the commoditized enterprise IT work
p. 7 · Read in context →
Amentum Holdings, Inc. (AMTM)
A large government mission-and-engineering services contractor (defense, intelligence, space, nuclear/environmental) formed in part from Jacobs's former government business. Amentum names KBR by name as a primary competitor.
Amentum's FY2025 10-K lists KBR Inc. among its named primary competitors in U.S. government services.
Amentum's primary competitors include Booz Allen Hamilton Inc., CACI International Inc., KBR Inc., Leidos Holdings Inc., ManTech International Corporation, Parsons Corporation, Peraton Corporation, Science Applications International Corporation and V2X, Inc. Our domestic competition also includes large defense contractors such as Boeing Co., BAE Systems plc, General Dynamics Corporation, L3Harris Technologies Inc., Lockheed Martin Corporation, Northrop Grumman Corporation and RTX Corporation.
p. 10 · Read in context →
Amentum frames its addressable scope around C5ISR, space and digital modernization, cites a long-standing NASA space-operations franchise, and reports ~81% of revenue from direct U.S. Government contracts.
Our expertise is broadly applicable to many of the government's highest priority areas including command, control, communications, computer, combat systems, intelligence, surveillance and reconnaissance (collectively, "C5ISR"), RDT&E, energy, space, and digital modernization. […] our expertise in space operations, developed via our longstanding trusted relationship with NASA, which will help foster the development of next-generation civil and commercial space programs […] Approximately 81% of the Company's revenues were derived through direct contracts with agencies of the U.S. Government for the year ended October 3, 2025.
p. 6 · Read in context →
Amentum's CEO defines the company's core growth areas as intelligence operations, environmental remediation and defense engineering, logistics and modernization.
John Heller (Chief Executive Officer): Our core growth areas where we have long-standing leadership positions across large, stable, mission critical areas provide dependable revenue, strong cash flow, and predictable returns […] some notable areas include RDT&E, intelligence operations and analysis, homeland security and border protection, environmental remediation, and defense engineering, logistics, and modernization.
p. 3 · Read in context →
Technip Energies N.V. (TE)
A leading energy-transition engineering and process-technology licensor (LNG, hydrogen, ammonia, ethylene) that competes with KBR's Sustainable Technology Solutions segment — while also partnering with KBR in the KTJV joint venture on LNG.
Technip Energies names KBR as its partner in the KTJV joint venture selected for the Lake Charles LNG export project — a case where the two firms partner even as they compete elsewhere in process technology.
The KTJV joint-venture between Technip Energies and KBR has been chosen for a Major […] contingent on Lake Charles LNG's final investment decision.
p. 30 · Read in context →
Technip Energies claims the single largest installed base of on-purpose hydrogen plants of any engineering-and-technology company — a market KBR's clean-hydrogen licensing also targets.
the Group has delivered more than 275 hydrogen plants to its clients over the past 65 years, an estimated 30% of the installed base for on-purpose hydrogen, which represents the largest share of plants that a single engineering and technology company has delivered.
p. 16 · Read in context →
Technip Energies claims world leadership in polymer-resin and petrochemical process units, with more than 350 facilities delivered — overlapping KBR's petrochemicals and chemical-recycling licensing.
A world leader in the process design, engineering, procurement and construction of units for the production of polymer resins and other petrochemical derivatives, Technip Energies has delivered more than 350 facilities over the last 50 years.
p. 21 · Read in context →
Booz Allen Hamilton Holding Corporation (BAH)
The largest provider of technology consulting and analytics to U.S. defense and intelligence agencies, and the self-described largest AI provider to the federal government — the incumbent KBR contends with as it pushes AI and digital modernization into the same missions.
Booz Allen's FY2026 10-K claims the leading position in AI-for-government (about 400 active AI projects) alongside a top-tier federal/defense/intelligence cyber business.
As the federal government's largest AI provider with approximately 400 active AI projects, we build secure AI solutions and advanced capabilities spanning agentic AI, physical AI, and AI-Radio Access Network (AI-RAN), and other emerging technologies designed for mission critical environments. […] We also have one of the most impactful cyber businesses globally, protecting U.S. federal, defense, and intelligence agencies
p. 7 · Read in context →
Booz Allen's CEO frames its defense and intelligence (“national security”) portfolio as materially stronger than the civil sector and asserts leadership in cyber, AI and warfighting technologies.
Horacio Rozanski (Chairman, Chief Executive Officer and President): The conditions in our defense and intelligence sectors, broadly referred to as our national security portfolio, are fundamentally different and considerably stronger than those in the civil sector. […] our leadership in cybersecurity, AI, and war fighting technologies is highly relevant to government technology and mission priorities.
p. 2 · Read in context →
Jacobs Solutions Inc. (J)
A global engineering and technical-services firm that historically competed head-to-head with KBR in defense, space and intelligence before spinning that government business into Amentum in 2024; today the overlap sits in energy, environment and advanced-facilities engineering.
Jacobs describes the defense, space, intelligence and energy government-services business it spun off into Amentum in 2024 — a client base and scope that closely mirror KBR's Government Solutions.
Prior to the Separation Transaction, Jacobs' Critical Mission Solutions line of business provided a full spectrum of solutions for clients to address evolving challenges like digital transformation and modernization, national security and defense, space exploration, digital asset management, the clean energy transition, and nuclear decommissioning and cleanup. […] Clients included the U.S. Department of Defense (DoD), the Combatant Commands, the U.S. Intelligence Community, NASA, the U.S. Department of Energy (DoE)
p. 15 · Read in context →
Jacobs's FY2025 10-K names its own competitor set for engineering and consulting markets — several of them (Fluor, Bechtel, Parsons, AtkinsRealis) also rivals of KBR — but does not name KBR itself.
We compete with many companies across the world including technology, consulting and engineering firms. Typically, no single company or companies dominate the markets in which we provide services, and often we partner with our competitors or other companies to jointly pursue projects. […] Bechtel, Arup, Endava, Exponent, Mott MacDonald, Stantec, Parsons, Accenture, Mace, AtkinsRealis, Altair, Montrose, Capgemini, Fluor, Deloitte, KPMG, PwC, Bain & Company and McKinsey & Company are some of our competitors.
p. 12 · Read in context →
More peer documents
Amentum — FY2024 Form 10-K — FY2024 · 101 pages · Prior-year 10-K names the identical primary-competitor set including KBR Inc., confirming the KBR designation is recurring. · Open →
Leidos — Q4 FY2025 earnings call — Q4 FY2025 · 13 pages · CEO cites a 1.3x book-to-bill and 15% funded-backlog growth plus a large near-term pipeline — demand read-through for the government-services pool KBR bids into. · Open →
Leidos — Q1 FY2026 earnings call — Q1 FY2026 · 11 pages · Intelligence-community mission-support growth and Leidos's “trusted mission AI” strategy — the AI-for-government push that collides with KBR intelligence and IT modernization. · Open →
SAIC — Q1 FY2026 earnings call — Q1 FY2026 · 15 pages · Space Development Agency mission-integrator win and alignment to DoD priorities across space, missile defense and intelligence — direct space/defense collision with KBR. · Open →
Amentum — Q2 FY2026 earnings call — Q2 FY2026 · 9 pages · CEO sizes the combined addressable market as growing 10%+ annually across nuclear energy and space systems — the space/nuclear scope KBR also targets. · Open →
Technip Energies — FY2025 annual report — FY2025 · 392 pages · Current-year restatement of the hydrogen (30% installed base) and ethylene-licensing leadership claims, and lists KBR Inc. among its U.S. peer companies. · Open →
Booz Allen — Q3 FY2026 earnings call — Q3 FY2026 · 12 pages · Fullest read on the DOGE-era federal-efficiency environment (slower funding, thinned acquisition workforce) plus the exclusive a16z government technology partnership. · Open →
Jacobs — Q2 FY2026 earnings call — Q2 FY2026 · 11 pages · Record backlog, 1.4x book-to-bill, #1 ENR design-firm ranking and triple-digit data-center growth — Jacobs's momentum in the advanced-facilities/energy markets that overlap KBR. · Open →
Source: S&P Capital IQ consensus via Xpressfeed · Generated 2026-07-17.
Street snapshot
Seven analysts set a mean price target of USD 46.57 (median 45), spanning a wide 36 to 60 range.
Currency: USD · Scale: money in millions, absolute (per share) · Analyst counts shown explicitly; recommendation respondents: 8.
| Street view | Reading | Analysts |
|---|---|---|
| Recommendation mix | Buy 4, Outperform 0, Hold 4, Underperform 0, Sell 0 | 8 |
| Consensus score | 2.00 | 8 |
| Target price | mean 46.57; high 60.00; low 36.00 | 7 |
Forward table
Consensus frames low-single-digit revenue growth, from FY2025's actual USD 7,786m to roughly 7,982m, 8,411m and 8,696m across FY2026-FY2028, with gross margin holding near 16% and normalized EPS drifting from 3.93 to about 4.13. Coverage thins in the outer years, with revenue contributors falling from 11 in FY2025 to 3 by FY2028.
Currency: USD · Scale: money in millions, absolute (per share) · Analyst count is the estimate count for each period and metric.
| Period | Metric | Mean | YoY | Analysts | Low / high |
|---|---|---|---|---|---|
| FY0E | Revenue | 7,982 | 2.5% | 9 | 7,760 / 8,242 |
| FY0E | EBITDA | 999.4 | 3.2% | 9 | 966.2 / 1,020 |
| FY0E | EBIT | 807.6 | 4.9% | — | — / — |
| FY0E | Net income (GAAP) | 468.2 | 12.8% | 5 | 439.4 / 480.0 |
| FY0E | Net income (normalized) | 499.5 | 0.7% | — | — / — |
| FY0E | EPS (GAAP) | 3.69 | 15.1% | 5 | 3.50 / 3.79 |
| FY0E | EPS (normalized) | 3.96 | 0.8% | 9 | 3.83 / 4.05 |
| FY0E | Free cash flow | 399.0 | -32.4% | — | — / — |
| FY0E | Dividend per share | 0.67 | 0.9% | — | — / — |
| FY0E | Gross margin | 16.0% | 1.5% | — | — / — |
| FY0E | Capital expenditure | -44.85 | 33.7% | — | — / — |
| FY0E | Net debt | 1,916 | -7.1% | — | — / — |
| FY0E | Cash from operations | 511.0 | -8.8% | — | — / — |
| FY0E | ROE | 30.3% | -6.9% | — | — / — |
| FY+1E | Revenue | 8,411 | 5.4% | 9 | 8,110 / 8,625 |
| FY+1E | EBITDA | 1,009 | 0.9% | 9 | 941.9 / 1,097 |
| FY+1E | EBIT | 825.5 | 2.2% | — | — / — |
| FY+1E | Net income (GAAP) | 493.4 | 5.4% | 5 | 443.9 / 558.0 |
| FY+1E | Net income (normalized) | 506.9 | 1.5% | — | — / — |
| FY+1E | EPS (GAAP) | 3.92 | 6.2% | 5 | 3.67 / 4.39 |
| FY+1E | EPS (normalized) | 4.13 | 4.2% | 9 | 3.77 / 4.59 |
| FY+1E | Free cash flow | 554.2 | 38.9% | — | — / — |
| FY+1E | Dividend per share | 0.72 | 8.1% | — | — / — |
| FY+1E | Gross margin | 15.8% | -1.1% | — | — / — |
| FY+1E | Capital expenditure | -46.87 | 4.5% | — | — / — |
| FY+1E | Net debt | 1,582 | -17.4% | — | — / — |
| FY+1E | Cash from operations | 482.4 | -5.6% | — | — / — |
| FY+1E | ROE | 25.8% | -14.8% | — | — / — |
| FY+2E | Revenue | 8,696 | 3.4% | 3 | 8,179 / 8,993 |
| FY+2E | EBITDA | 969.1 | -3.9% | 3 | 908.0 / 1,024 |
| FY+2E | EBIT | 794.3 | -3.8% | — | — / — |
| FY+2E | Net income (GAAP) | 457.9 | -7.2% | 2 | 422.7 / 493.1 |
| FY+2E | Net income (normalized) | 497.5 | -1.8% | — | — / — |
| FY+2E | EPS (GAAP) | 3.82 | -2.7% | 2 | 3.63 / 4.01 |
| FY+2E | EPS (normalized) | 4.13 | 0.1% | 3 | 3.88 / 4.27 |
| FY+2E | Dividend per share | 0.75 | 4.2% | — | — / — |
| FY+2E | Gross margin | 16.1% | 1.7% | — | — / — |
| FY+2E | Capital expenditure | -85.54 | 82.5% | — | — / — |
| FY+2E | Net debt | 1,214 | -23.2% | — | — / — |
| FY+2E | ROE | 23.0% | -10.8% | — | — / — |
| Q2 FY2026 | Revenue | 1,869 | -4.3% | 8 | 1,742 / 1,939 |
| Q2 FY2026 | EBITDA | 230.8 | -4.6% | 8 | 215.8 / 250.2 |
| Q2 FY2026 | EBIT | 188.4 | -3.1% | — | — / — |
| Q2 FY2026 | Net income (GAAP) | 111.4 | 52.6% | 5 | 101.3 / 121.8 |
| Q2 FY2026 | Net income (normalized) | 114.6 | -2.8% | — | — / — |
| Q2 FY2026 | EPS (GAAP) | 0.88 | 56.4% | 5 | 0.80 / 0.95 |
| Q2 FY2026 | EPS (normalized) | 0.90 | -0.7% | 8 | 0.85 / 1.00 |
| Q2 FY2026 | Dividend per share | 0.17 | -1.0% | — | — / — |
| Q2 FY2026 | Gross margin | 16.1% | 7.1% | — | — / — |
| Q2 FY2026 | Capital expenditure | -10.16 | -33.6% | — | — / — |
| Q2 FY2026 | ROE | 28.5% | -12.7% | — | — / — |
| Q3 FY2026 | Revenue | 2,058 | 6.6% | 8 | 1,966 / 2,127 |
| Q3 FY2026 | EBITDA | 256.2 | 6.7% | 8 | 238.0 / 272.9 |
| Q3 FY2026 | EBIT | 212.0 | 8.1% | — | — / — |
| Q3 FY2026 | Net income (GAAP) | 125.6 | 9.2% | 5 | 111.0 / 135.9 |
| Q3 FY2026 | Net income (normalized) | 131.1 | 7.4% | — | — / — |
| Q3 FY2026 | EPS (GAAP) | 0.99 | 10.3% | 5 | 0.89 / 1.08 |
| Q3 FY2026 | EPS (normalized) | 1.03 | 1.1% | 8 | 0.95 / 1.13 |
| Q3 FY2026 | Dividend per share | 0.17 | -1.0% | — | — / — |
| Q3 FY2026 | Gross margin | 16.3% | 4.3% | — | — / — |
| Q3 FY2026 | Capital expenditure | -11.06 | 24.0% | — | — / — |
| Q3 FY2026 | ROE | 33.6% | 4.5% | — | — / — |
| Q4 FY2026 | Revenue | 2,100 | 11.4% | 8 | 2,001 / 2,204 |
| Q4 FY2026 | EBITDA | 260.0 | 9.2% | 8 | 242.5 / 271.6 |
| Q4 FY2026 | EBIT | 214.2 | 7.3% | — | — / — |
| Q4 FY2026 | Net income (GAAP) | 126.9 | 14.3% | 5 | 116.2 / 139.0 |
| Q4 FY2026 | Net income (normalized) | 133.7 | 9.7% | — | — / — |
| Q4 FY2026 | EPS (GAAP) | 1.01 | 15.6% | 5 | 0.91 / 1.10 |
| Q4 FY2026 | EPS (normalized) | 1.06 | 6.6% | 8 | 0.95 / 1.12 |
| Q4 FY2026 | Dividend per share | 0.17 | -1.0% | — | — / — |
| Q4 FY2026 | Gross margin | 16.3% | -1.0% | — | — / — |
| Q4 FY2026 | Capital expenditure | -11.47 | 51.4% | — | — / — |
| Q4 FY2026 | ROE | 30.9% | -2.2% | — | — / — |
| Q1 FY2027 | Revenue | 2,060 | 7.1% | 5 | 2,006 / 2,115 |
| Q1 FY2027 | EBITDA | 263.4 | 5.0% | 5 | 248.0 / 270.3 |
| Q1 FY2027 | EBIT | 222.4 | 18.1% | — | — / — |
| Q1 FY2027 | Net income (GAAP) | 131.7 | 29.2% | 3 | 125.0 / 136.1 |
| Q1 FY2027 | Net income (normalized) | 137.7 | 19.8% | — | — / — |
| Q1 FY2027 | EPS (GAAP) | 1.05 | 31.3% | 3 | 0.98 / 1.09 |
| Q1 FY2027 | EPS (normalized) | 1.10 | 14.8% | 5 | 0.98 / 1.15 |
| Q1 FY2027 | Dividend per share | 0.20 | 18.2% | — | — / — |
| Q1 FY2027 | Gross margin | 17.2% | 7.0% | — | — / — |
| Q1 FY2027 | Capital expenditure | -11.66 | 16.0% | — | — / — |
| Q1 FY2027 | ROE | 30.9% | -0.5% | — | — / — |
Estimate momentum
FY2027 estimates have edged lower over the past six months, revenue easing from about 8,582m (180 days ago) to 8,411m and normalized EPS from 4.34 to 4.13. The FY2028 cuts are larger — normalized EPS from 6.37 to 4.13 — but rest on only three estimates, so the signal is weak.
Currency: USD · Scale: money in millions, absolute (per share) · Point-in-time consensus; analyst count is shown where supplied.
| Period | Metric | Lookback | Then | Now | Direction / magnitude | Analysts |
|---|---|---|---|---|---|---|
| 2027 | EPS (normalized) | 30d | 4.15 | 4.13 | down 0.5% | — |
| 2027 | EPS (normalized) | 90d | 4.20 | 4.13 | down 1.6% | — |
| 2027 | EPS (normalized) | 180d | 4.34 | 4.13 | down 4.9% | — |
| 2027 | Revenue | 30d | 8,411 | 8,411 | up 0.0% | — |
| 2027 | Revenue | 90d | 8,453 | 8,411 | down 0.5% | — |
| 2027 | Revenue | 180d | 8,582 | 8,411 | down 2.0% | — |
| 2028 | Revenue | 30d | 8,696 | 8,696 | flat 0.0% | — |
| 2028 | Revenue | 90d | 8,889 | 8,696 | down 2.2% | — |
| 2028 | Revenue | 180d | 9,852 | 8,696 | down 11.7% | — |
| 2028 | EPS (normalized) | 30d | 4.13 | 4.13 | flat 0.0% | — |
| 2028 | EPS (normalized) | 90d | 4.70 | 4.13 | down 12.1% | — |
| 2028 | EPS (normalized) | 180d | 6.37 | 4.13 | down 35.1% | — |
Beat / miss record
Current sequences by metric: Revenue: 1 consecutive beat; EPS (normalized): 6 consecutive beats.
Currency: USD · Scale: money in millions, absolute (per share) · Consensus is captured before each actual first became effective; analyst count shown per observation.
| Quarter | Metric | Consensus as of | Actual | Surprise | Outcome | Analysts |
|---|---|---|---|---|---|---|
| Q1 FY2026 | Revenue | 1,877 | 1,923 | 2.4% | Beat | — |
| Q1 FY2026 | EPS (normalized) | 0.91 | 0.96 | 5.5% | Beat | — |
| Q4 FY2025 | Revenue | 1,905 | 1,885 | -1.1% | Miss | — |
| Q4 FY2025 | EPS (normalized) | 0.95 | 0.99 | 4.4% | Beat | — |
| Q3 FY2025 | Revenue | 1,973 | 1,931 | -2.1% | Miss | — |
| Q3 FY2025 | EPS (normalized) | 0.95 | 1.02 | 6.9% | Beat | — |
| Q2 FY2025 | Revenue | 2,081 | 1,952 | -6.2% | Miss | — |
| Q2 FY2025 | EPS (normalized) | 0.88 | 0.91 | 3.0% | Beat | — |
| Q1 FY2025 | Revenue | 2,072 | 2,055 | -0.8% | Miss | — |
| Q1 FY2025 | EPS (normalized) | 0.86 | 0.98 | 13.7% | Beat | — |
| Q4 FY2024 | Revenue | 1,999 | 2,122 | 6.2% | Beat | — |
| Q4 FY2024 | EPS (normalized) | 0.82 | 0.91 | 11.4% | Beat | — |
| Q3 FY2024 | Revenue | 1,959 | 1,947 | -0.6% | Miss | — |
| Q3 FY2024 | EPS (normalized) | 0.84 | 0.84 | -0.0% | Miss | — |
| Q2 FY2024 | Revenue | 1,876 | 1,855 | -1.1% | Miss | — |
| Q2 FY2024 | EPS (normalized) | 0.79 | 0.83 | 4.7% | Beat | — |
Where the street disagrees
Disagreement concentrates in the outer years, where coverage falls to a handful of analysts: FY2028 revenue carries a USD 367m standard deviation across just three estimates, and its GAAP net income rests on only two. Near-term lines are markedly tighter.
Currency: USD · Scale: money in millions, absolute (per share) · Dispersion is high-low divided by absolute mean; analyst count shown per item.
| Period | Metric | Mean | Low | High | Spread / mean | Analysts |
|---|---|---|---|---|---|---|
| Q3 FY2025 | Net income (GAAP) | 106.2 | 81.31 | 116.0 | 32.7% | 4 |
| Q3 FY2025 | EPS (GAAP) | 0.82 | 0.63 | 0.89 | 31.4% | 4 |
| 2027 | Net income (GAAP) | 493.4 | 443.9 | 558.0 | 23.1% | 5 |
| Q2 FY2025 | EPS (normalized) | 0.88 | 0.80 | 0.99 | 21.5% | 6 |
| Q2 FY2025 | Net income (GAAP) | 110.5 | 100.0 | 123.0 | 20.8% | 4 |
Source: Visible Alpha consensus via S&P Xpressfeed · Consensus as of 2026-07-14 · generated 2026-07-17.
Model trust
Base currency: USD · VA scales normalized from Abs, M; item currencies and units retained · Coverage depth and vintage; broker count is the maximum represented.
| Brokers | Line items | Last revision |
|---|---|---|
| 10 | 373 | 2026-07-14 |
Operating KPIs
Base currency: USD · VA scales normalized from Abs, M; item currencies and units retained · FY-1A / FY0E / FY+1E; broker count shown per KPI.
| Operating KPI | Source | FY-1A | FY0E | FY+1E | Brokers |
|---|---|---|---|---|---|
| Revenue - Mission Technology | CD | 5,679,519.42bn Amount | 5,339,977.03bn Amount | 5,592,716.07bn Amount | 10 |
| Revenue - Sustainable technology solutions | CD | 2,167,626.61bn Amount | 2,787,897.75bn Amount | 2,956,463.14bn Amount | 10 |
| Revenues | CD | 7,847,154.54bn Amount | 8,010,560.24bn Amount | 8,428,532.14bn Amount | 10 |
| D&A | CD | 168,586.82bn Amount | 172,380.75bn Amount | 174,796.82bn Amount | 9 |
| Interest (income) expense | CD | -160,065.50bn Amount | -145,854.98bn Amount | -136,229.98bn Amount | 9 |
| Operating margin - Operating(%) | CD | 10.2% | 10.2% | 9.6% | 9 |
| Cost of sales | CD | 6,683,472.53bn Amount | 6,733,906.97bn Amount | 7,050,526.24bn Amount | 8 |
| General and administrative expenses | CD | 575,873.54bn Amount | 575,906.45bn Amount | 593,171.30bn Amount | 8 |
| Minority interests | CD | 3,050.00bn Amount | 4,000.00bn Amount | 8,000.00bn Amount | 8 |
| Other non operating gains and losses | CD | 597.50bn Amount | 2,930.00bn Amount | 2,930.00bn Amount | 8 |
| ( Increase)/decrease in cash and equivalents | CD | 179,784.08bn Amount | 13,886.79bn Amount | 180,011.72bn Amount | 7 |
| (Increase)/ decrease in accounts payable | CD | -79,442.74bn Amount | -5,884.94bn Amount | 42,848.52bn Amount | 7 |
P&L bridge
Base currency: USD · VA scales normalized from Abs, M; item currencies and units retained · Margins are derived against revenue; YoY compares adjacent fiscal columns; broker count shown per line.
| P&L line | FY-1A | FY0E | FY+1E | Brokers |
|---|---|---|---|---|
| Revenue | 7,847,154.54bn Amount | 8,010,560.24bn Amount (2.1% YoY) | 8,428,532.14bn Amount (5.2% YoY) | 10 |
| Gross Profit | 1,217,142.88bn Amount (15.5% margin) | 1,306,067.58bn Amount (16.3% margin; 7.3% YoY) | 1,351,283.79bn Amount (16.0% margin; 3.5% YoY) | 10 |
| Ebitda | 966,647.64bn Amount (12.3% margin) | 1,001,198.02bn Amount (12.5% margin; 3.6% YoY) | 987,585.11bn Amount (11.7% margin; -1.4% YoY) | 10 |
| Operating Income | 797,693.42bn Amount (10.2% margin) | 815,173.46bn Amount (10.2% margin; 2.2% YoY) | 802,312.46bn Amount (9.5% margin; -1.6% YoY) | 9 |
| Net Income | 473,507.34bn Amount (6.0% margin) | 491,571.05bn Amount (6.1% margin; 3.8% YoY) | 506,085.17bn Amount (6.0% margin; 3.0% YoY) | 10 |
| Eps | 3.67 Amount | 3.89 Amount (5.9% YoY) | 4.05 Amount (4.1% YoY) | 10 |
Consensus dispersion
Base currency: USD · VA scales normalized from Abs, M; item currencies and units retained · Top high-low spreads relative to absolute mean; requires at least 3 brokers.
| Line item | Period | Mean | Min | Q1 | Q3 | Max | Spread / mean | Brokers |
|---|---|---|---|---|---|---|---|---|
| (Increase)/ decrease in accounts payable | 4QFY-2026 | 772.41bn Amount | -41,748.46bn Amount | -24,578.97bn Amount | 26,874.20bn Amount | 41,792.45bn Amount | 10815.7% | 4 |
| Other non operating gains and losses | FY-2025 | 597.50bn Amount | -5,000.00bn Amount | -5,000.00bn Amount | -2,500.00bn Amount | 29,780.00bn Amount | 5820.9% | 8 |
| (Increase)/ decrease in accounts payable | 2QFY-2026 | -5,619.56bn Amount | -86,178.38bn Amount | -45,958.61bn Amount | 15,542.47bn Amount | 113,293.29bn Amount | 3549.6% | 4 |
| ( Increase)/decrease in cash and equivalents | 2QFY-2026 | 6,617.71bn Amount | -118,493.75bn Amount | -8,757.81bn Amount | 52,756.73bn Amount | 70,202.16bn Amount | 2851.4% | 4 |
| (Increase)/ decrease in accounts payable | FY-2026 | -5,884.94bn Amount | -61,446.57bn Amount | -49,117.67bn Amount | 37,921.87bn Amount | 48,528.52bn Amount | 1868.8% | 4 |
| ( Increase)/decrease in cash and equivalents | FY-2026 | 13,886.79bn Amount | -70,987.74bn Amount | -63,559.28bn Amount | 53,075.10bn Amount | 175,276.87bn Amount | 1773.4% | 4 |
Quarterly path
Base currency: USD · VA scales normalized from Abs, M; item currencies and units retained · Next four supplied quarters; final column is maximum broker coverage in the row.
| Quarter | Revenue - Mission Technology | Revenue - Sustainable technology solutions | Revenues | D&A | Interest (income) expense | Total revenue | EPS Diluted, Applicable to common stockholders($) | Broker coverage |
|---|---|---|---|---|---|---|---|---|
| 3QFY-2026 | 1,399,543.60bn Amount | 748,351.08bn Amount | 2,100,850.43bn Amount | 44,528.85bn Amount | -36,400.08bn Amount | 2,100,850.43bn Amount | 1.03 Amount | 6 |
| 4QFY-2026 | 1,369,459.53bn Amount | 777,876.67bn Amount | 2,102,180.83bn Amount | 45,521.83bn Amount | -35,739.78bn Amount | 2,102,180.83bn Amount | 1.03 Amount | 6 |
| 1QFY-2027 | 1,412,640.00bn Amount | 677,160.00bn Amount | 2,055,716.31bn Amount | 42,751.13bn Amount | -34,622.59bn Amount | 2,055,716.31bn Amount | 1.10 Amount | 4 |
| 2QFY-2027 | 1,360,440.80bn Amount | 667,575.00bn Amount | 1,980,615.99bn Amount | 43,151.80bn Amount | -34,144.68bn Amount | 1,980,615.99bn Amount | 0.91 Amount | 4 |
87 stale period values omitted; 5 line items fully removed.
Source: S&P Capital IQ transcripts via Xpressfeed · latest indexed call 2026-05-05 · generated 2026-07-17.
Latest call digest
KBR, Inc., Q1 2026 Earnings Call, May 05, 2026 · 2026-05-05T12:30:00
KBR's Q1 2026 call (May 5, 2026) was a reaffirm-and-reassure quarter. Prepared remarks led with resilience: adjusted EBITDA margin expanded to 13.1% from 12.3%, adjusted operating cash flow was $119 million, and adjusted EPS was $0.96 (down $0.05 year-over-year). Management reaffirmed full-year 2026 guidance across all metrics and stressed visibility — work under contract covers roughly 67% of 2026 STS revenue guidance and 91% of MTS. Sustainable Tech again carried the bookings story: STS book-to-bill ex LNG of 1.2x, its third consecutive quarter above 1.0, with backlog of about $4.7 billion, up 9% year-over-year. Mission Tech was framed more cautiously — book-to-bill of 1.0, backlog and options of $18.5 billion, and $16 billion of bids awaiting award, with awards "not flowing at historical levels."
Two prepared-remarks items reset expectations. First, the spin of Mission Tech moved to an effective date of January 4, 2027, from the "second half of 2026" targeted a quarter earlier, with public Form 10 filing now expected in September and Investor Days in the second week of November. Second, management flagged a new NASA in-sourcing directive that could shift some contractor work back to government payroll; Stuart Bradie sized the gross impact at roughly $50 million to $60 million this year and said it would likely be less, offset by Sustainable Tech strength so full-year guidance holds on mix, not level.
The Q&A reality was tougher than the script. Analysts pressed on why the 13.1% margin ran ahead of the full-year guide, whether the STS margin ex LNG really builds toward 20%-plus (management held to a ~15%-and-rising base), and why the spin now looks behind schedule. Management declined to raise guidance despite a strong start — Bradie said getting "out over your skis" would not be prudent — and repeatedly deferred stand-alone economics and multi-year growth to the November Investor Days.
Participant coverage from the latest call.
| Group | Participants | Count |
|---|---|---|
| Management | Operator; Rachael Goldwait — Vice President of Investor Relations, KBR, Inc.; Stuart Bradie — CEO, President & Chairman, KBR, Inc.; Shad Evans — Executive VP & Chief Financial Officer, KBR, Inc. | 4 |
| Analysts | Adam Bubes — Research Analyst, Goldman Sachs Group, Inc., Research Division; Unknown Analyst; Jerry Revich — Equity Analyst, Wells Fargo Securities, LLC, Research Division; Ian Zaffino — MD & Senior Analyst, Oppenheimer & Co. Inc., Research Division; Mariana Perez Mora — Research Analyst, BofA Securities, Research Division; Tobey Sommer — Managing Director, Truist Securities, Inc., Research Division; Steven Fisher — Executive Director & Senior Analyst, UBS Investment Bank, Research Division | 7 |
Curated latest-call exchanges; one row per analyst topic.
| Analyst | Firm | Topic | What changed in Q&A |
|---|---|---|---|
| Adam Bubes | Goldman Sachs | Q1 margin beat and equity income | Asked what drove the 13.1% margin above the full-year guide; CFO tied it to long-term targets and continued LNG-project contribution into early 2027. |
| Unknown Analyst (for Andrew Kaplowitz) | Citi | STS margin ex LNG | Pressed on the underlying STS margin path versus the 20%-plus framework; management set the base business near 15% ex LNG and rising, driven by technology and JV OpEx mix. |
| Jerry Revich | Wells Fargo | NASA in-sourcing and LNG backfill | Management quantified the NASA in-sourcing headwind at roughly $50-60 million gross this year, likely less, and expressed confidence in backfilling the rolling-off LNG project through STS bookings momentum. |
| Ian Zaffino | Oppenheimer | Middle East bookings and spin timing | Questioned why the spin looks behind schedule; management framed the January 4, 2027 date as fiscal-year alignment plus schedule float for IT separation, not a problem signal. |
| Mariana Perez Mora | BofA | STS closeout size and multi-year growth | Management declined to size the STS project closeout and deferred the two-to-three-year growth trajectory to the Investor Days. |
| Steven Fisher | UBS | Guidance raise and STS project maturity | Management declined to raise guidance despite a beat, citing macro volatility, and characterized the STS pipeline as maturing projects rather than early-stage concepts. |
Theme tracker
Themes are curator-classified across supplied calls.
| Theme | Status | Quarters mentioned | Read-through |
|---|---|---|---|
| Mission Tech spin-off | emerged | Q3 2025, Q4 2025, Q1 2026 | Announced September 24, 2025 and central to every call since; the target has drifted from "mid- to late 2026" to an effective date of January 4, 2027, and stand-alone economics keep being deferred to Investor Days. |
| HomeSafe program | dropped | Q2 2024, Q3 2024, Q4 2024, Q1 2025, Q2 2025 | A recurring growth pillar for roughly two years; TRANSCOM terminated the contract in Q2 2025 and it has been absent from the last three calls, so its disappearance reflects a real lost program rather than de-emphasis. |
| MTS award delays and protests | persisted | Q1 2025, Q2 2025, Q4 2025, Q1 2026 | Protest activity and slow award cadence have weighed on Mission Tech revenue for several quarters, with roughly $2 billion in awards stuck in protest through 2025 and the MIST contract cited most recently. |
| NASA funding and in-sourcing uncertainty | persisted | Q2 2025, Q3 2025, Q4 2025, Q1 2026 | NASA budget risk has recurred, evolving from broad appropriations uncertainty into a specific in-sourcing directive in Q1 2026 that management sized at roughly $50-60 million gross this year. |
| LNG project margin and backfill | persisted | Q4 2024, Q2 2025, Q4 2025, Q1 2026 | The consolidated LNG project has been a repeated STS margin tailwind; the debate has shifted to how the portfolio backfills the ~500 basis points it contributes as it rolls off into 2027. |
| EUCOM contingency roll-off | persisted | Q2 2025, Q3 2025, Q4 2025, Q1 2026 | The planned wind-down of EUCOM/Ukraine contingency work is a recurring year-over-year revenue headwind that management flags as low-margin and largely anticipated. |
Guidance ledger
Quotes, calls, and speakers are source-verified; outcomes are curator-classified.
| Verbatim guidance | Call | Speaker | Curator outcome | Outcome note |
|---|---|---|---|---|
| “we are guiding revenues in the range of $7.9 billion to $8.36 billion, adjusted EBITDA of $980 million to $1.04 billion, adjusted EPS of $3.87 to $4.22 and adjusted operating cash flow of $560 million to $600 million.” | KBR, Inc., Q4 2025 Earnings Call, Feb 26, 2026 · 2026-02-26T13:30:00 | Shad Evans | pending | Reaffirmed across all metrics on the Q1 2026 call; full-year outcome not yet resolved in the supplied history. |
| “We expect to bid more than $25 billion in 2026, and that will be up double digits year-over-year.” | KBR, Inc., Q4 2025 Earnings Call, Feb 26, 2026 · 2026-02-26T13:30:00 | Stuart Bradie | pending | On the Q1 2026 call management said it continues to make progress toward the $25 billion bid-volume goal, with significant submissions expected in the next two quarters. |
| “our targeted distribution is anticipated in the second half of 2026.” | KBR, Inc., Q4 2025 Earnings Call, Feb 26, 2026 · 2026-02-26T13:30:00 | Stuart Bradie | missed | On the Q1 2026 call the spin was moved to an effective date of January 4, 2027, pushing the distribution out of the second half of 2026. |
| “we expect revenue in the range of $8.7 billion to $9.1 billion, representing an increase of 15% at the midpoint.” | KBR, Inc., Q4 2024 Earnings Call, Feb 24, 2025 · 2025-02-24T21:00:00 | Mark Sopp | missed | Revenue guidance was cut to $7.9-8.1 billion in Q2 2025 after the HomeSafe termination; the Q4 2025 call reported full-year 2025 revenue of approximately $7.8 billion. |
| “Our estimated revenue range is $300 million to $500 million for the year.” | KBR, Inc., Q4 2024 Earnings Call, Feb 24, 2025 · 2025-02-24T21:00:00 | Mark Sopp | missed | This HomeSafe revenue assumption was removed after TRANSCOM terminated the HomeSafe contract, disclosed on the Q2 2025 call. |
Q&A pressure map
Question counts and firms are curator tallies; analyst coverage shown above.
| Topic | Questions | Firms | Pressure / response |
|---|---|---|---|
| STS margin structure ex LNG | 3 | Goldman Sachs, Citi | The most-pressed topic on the Q1 2026 call: analysts probed why the reported margin ran ahead of guide and whether the base business really builds toward 20%-plus once the LNG project rolls off. |
| NASA in-sourcing exposure | 2 | Wells Fargo, Truist | Analysts pushed on the size and timing of the NASA in-sourcing directive; management answered directly, sizing it at roughly $50-60 million gross and noting it affects mainly one contract. |
| Spin timing and portfolio | 2 | Oppenheimer, BofA | On the Q1 2026 call analysts asked why the spin looks behind schedule and whether parts of MTS could be sold; management defended the January 2027 date as fiscal-year alignment and said it would weigh any offer on shareholder value. |
| STS pipeline and LNG backfill | 2 | Wells Fargo, UBS | Analysts pressed on how much visibility supports replacing the LNG project and how mature the STS pipeline is; management pointed to a third straight strong bookings quarter and front-end work on three LNG projects. |
| Guidance upside and multi-year growth | 2 | UBS, BofA | Requests to lean toward the upper end of guidance and to frame two-to-three-year growth were deflected — the first citing macro volatility, the second deferred to the November Investor Days. |
Language shifts
Only language evidence verified against the referenced component is shown.
| Observation | Verbatim evidence | Call ID | Component |
|---|---|---|---|
| Management introduced explicit wider-outcome caution around the government portfolio when reaffirming 2026 guidance, framing the range of results as unusually broad. | “the range of potential outcomes is wider than normal for our Government Services portfolio.” | 1993638985 | 3 |
| Management continued to describe the Mission Tech award backdrop in subdued terms, a caution that has persisted through the soft-award cycle. | “awards are not flowing at historical levels.” | 1993638985 | 2 |
| In the closing remarks, management characterized the near-term Mission Tech award environment as uneven, a measured tone versus the growth framing of earlier years. | “the near-term award environment remains uneven. It's a good way to describe it.” | 1993638985 | 44 |
| On guidance, management leaned on colloquial caution to explain why it would not raise after a strong start, signaling deliberate conservatism amid macro volatility. | “to get out over your skis right now would not generally be viewed positively” | 1993638985 | 40 |
The call history shows a company managing through a soft government-award cycle — protests, EUCOM roll-off and now a NASA in-sourcing directive — while Sustainable Tech bookings strengthen and the Mission Tech spin advances. With the spin slipped to January 2027 and stand-alone economics repeatedly deferred to the November Investor Days, the central question of each business's independent earnings power stays unresolved for now.
KBR: the business, the record, and the question
KBR is a $7.8 billion-revenue provider of engineering, technical and mission services, split between government programs and licensed process technology. Over four years operating margins roughly doubled and adjusted earnings kept beating estimates, yet the stock trades near $35 — about 40% below its late-2024 high and roughly nine times forward earnings. This report exists to test whether that de-rating misprices a structurally better business or fairly prices a government-dependent contractor.
What KBR is
KBR, Inc. (NYSE: KBR) is a Houston-based descendant of Kellogg Brown & Root, spun out of Halliburton and public since 2006. It no longer builds the large energy-and-construction projects that once defined it. Today it sells knowledge work — engineering, systems integration, program management, data analytics — plus a portfolio of patented industrial process technologies. The business is organized into two core segments [1]:
- Mission Technology Solutions (MTS) — full life-cycle support to defense, intelligence, space and aviation programs for the U.S., U.K. and Australian governments, spanning research, prototyping, systems engineering, C5ISR, cyber and program management [2]. At $5.6 billion of FY2025 revenue, MTS is roughly 72% of the company.
- Sustainable Technology Solutions (STS) — a portfolio of over 85 proprietary, sustainability-focused process technologies (ammonia/syngas, chemicals/petrochemicals, clean refining, circular economy) that KBR licenses, along with proprietary equipment, catalysts and high-end engineering and advisory work [3]. At $2.2 billion, STS is about 28% of revenue — but, as the segment economics below show, a much larger share of the profit.
Revenue (FY2025)
Operating Income
Net Income (to KBR)
Backlog
Market Cap
Forward P/E
Revenue, operating income, net income and backlog: FY2025 Form 10-K (year ended Jan 2, 2026) [4], backlog p.20 [5]. Market cap and forward P/E derived from the $35.17 close on Jul 17, 2026, ~129M shares, and consensus estimates.
KBR labels the year ended January 2, 2026 as fiscal 2025; its 52/53-week calendar means fiscal years end in late December or early January. All figures here follow that convention.
How it makes money
The two segments earn their profit very differently, and this is the first thing a new reader should internalize. MTS is the scale engine — large, recurring, mostly cost-reimbursable and fixed-price government contracts that turn over slowly and carry single-digit margins. STS is the profit engine — licensing and proprietary technology that carry more than double the operating margin. In FY2025, STS produced slightly more segment operating income than MTS on less than half the revenue.
Source: FY2025 Form 10-K, Results of Operations by Business Segment [6]. Corporate expense of $162M (not shown) reconciles segment income to the $778M consolidated operating figure.
Two structural features follow from this mix. First, KBR's profitability is more sensitive to STS — the smaller, higher-margin, more cyclical, energy-and-chemicals-exposed segment — than its revenue split suggests. Second, a meaningful slice of profit sits outside consolidated operations: FY2025 operating income included $210 million of equity in earnings of unconsolidated joint ventures, nearly double the prior year, and about 17% of backlog is work executed through equity-method JVs [7]. How readily that JV profit converts to KBR cash is a question later chapters should press.
The financial record
The reported numbers describe a business that has grown revenue and expanded margin steadily since 2022. Operating income rose from $343 million to $778 million over three years, lifting the operating margin from roughly 5% to 10% [8].
Source: FY2023 and FY2025 Forms 10-K, Consolidated Statements of Operations [9].
The one blemish in that record is FY2023, when KBR reported a net loss of $265 million. It is worth being precise about why, because the headline reads worse than the year was. The loss did not come from operations — operating income that year was still a positive $449 million. It came almost entirely from two below-the-line, largely one-time items: a $494 million charge to settle its Convertible Notes, and a $144 million charge (recorded within operating income) to settle a legacy legal matter [10]. The convertible charge was the swing factor that turned a profitable operating year into a reported loss.
Source: FY2023 figures per the FY2025 Form 10-K, Consolidated Statements of Operations [11]. Operating income already reflects the $144M legal settlement charge.
That episode matters twice over. It explains why a screen for "companies that lost money three years ago" flags KBR misleadingly. And it is a reminder that KBR's reported and adjusted numbers can diverge: even in the clean year FY2025, reported diluted EPS of $3.21 sat below the $3.49 earned by continuing operations, because a $55 million loss from discontinued operations — chiefly the terminated HomeSafe military-moving contract — dragged the total down [12]. The gap between what KBR earns operationally and what it reports on a GAAP basis is a theme this report will return to.
The de-rating
For a reader meeting KBR for the first time, the price chart is the reason the name is interesting now. The stock re-rated sharply from 2019 through 2024 as investors rewarded its pivot into defense, space and energy-transition markets, peaking near $58 at the end of 2024. It has since fallen to about $35 — a decline of roughly 40% — even as backlog, margins and adjusted earnings continued to rise.
Source: year-end closing share prices; 2026 value is the Jul 17, 2026 close, as reported.
What changed in 2025 was sentiment, not results. Two overhangs dominate. First, government-spending risk moved to the front page: on January 20, 2025 an executive order created the DOGE cost-cutting commission, and although it was disbanded in November 2025, the episode crystallized how exposed KBR is — U.S. government revenue was 57% of the FY2025 total [13]. Second, in June 2025 the U.S. Transportation Command abruptly terminated HomeSafe's role in the Global Household Goods Contract — a marquee win that KBR then moved to discontinued operations [14]. Against that, the operating business kept beating: reported quarterly EPS has topped consensus in every quarter of the last two years.
At $35, KBR trades near 11 times trailing GAAP earnings and roughly nine times consensus forward earnings of about $3.96, against a mean analyst target near $47. That forward multiple sits well below the broad market's, which trades near 20 times forward earnings.
Durability of the balance sheet
Because the de-rating invites the question of whether cheapness signals distress, the balance sheet deserves a first look here. It does not read as distressed. KBR carries about $2.6 billion of debt against $0.5 billion of cash, for net debt near $2.1 billion — roughly 2.2 times EBITDA — and generated $410 million of free cash flow in FY2025 [15]. The clearest balance-sheet caveat is that $2.7 billion of goodwill exceeds the $1.5 billion of shareholders' equity, so tangible book value is negative — a consequence of an acquisition-led strategy rather than a solvency signal, but a reason a careful reader will want the cash-conversion and covenant picture examined in detail later.
Net Debt
Net Debt / EBITDA
Free Cash Flow (FY2025)
U.S. Gov't % of Revenue
Sources: net debt and free cash flow derived from the FY2025 Form 10-K statements [16]; U.S. government revenue share p.31 [17].
The question this report answers
KBR presents as a "fallen star": a name the market prized for its growth pivot and now discounts, trading below the broad market's multiple despite a rising order book and consistent earnings beats. That framing fits some of this investor's preferences and fails others — the valuation is undemanding and the balance sheet is not distressed, but KBR is not founder-run, and its fortunes are tied to U.S. government budgets rather than to a controlling owner with skin in the game.
The through-line for the chapters that follow is a single question:
Does KBR's roughly 40% de-rating since late 2024 misprice a structurally improved, backlog-backed business — one earning most of its profit from higher-margin licensed technology and mission-critical government work, with a $16.9 billion order book and consistent earnings beats — or does it fairly price a contractor that draws 57% of revenue from U.S. government budgets, reports GAAP profits and cash below its adjusted headline numbers, and answers to no controlling owner?
Answering it means separating the durable from the cyclical in the earnings, testing how much of the reported profit becomes cash, judging whether the government and energy-transition tailwinds are real, and gauging how much pessimism the price already embeds. Those are the chapters to come.
Earnings to Cash
KBR's reported profit turns into cash cleanly. In the year ended January 2, 2026, operating cash flow of $557 million and free cash flow of $515 million both exceeded not only GAAP net income of $403 million but management's own adjusted earnings of $507 million [1] [2]. So cash conversion is not where the earnings-quality question sits. Composition is: nearly half of continuing profit now comes from joint ventures KBR does not consolidate, and that contribution has swung from an $80 million loss to a $210 million gain in three years.
A note on labels: KBR's 52/53-week calendar means its most recent year ended January 2, 2026. This chapter calls it FY2025, matching how KBR and the SEC label it.
Cash runs ahead of the accounting profit
Whether reported profit becomes cash is a basic test of earnings quality. Across the last three years — restated onto a continuing-operations basis in the latest 10-K — it does, with room to spare [3].
Source: FY2025 Annual Report (Form 10-K), Consolidated Statements of Cash Flows; free cash flow derived as operating cash flow less capital expenditures [4].
Operating cash flow rose from $301 million to $557 million over the three years, and free cash flow — after capital spending that runs just $42–62 million a year, or under 1% of revenue — climbed from $239 million to $515 million [5]. FY2023's net loss was the $494 million convertible-notes charge working below the operating line, a non-cash item added straight back in the cash-flow statement [6]; the business generated cash that year regardless.
Source: derived from FY2025 Annual Report (Form 10-K), Consolidated Statements of Cash Flows [7].
Cash conversion above 1.0x is not an accident of one year. It holds because depreciation and amortization ($169 million in FY2025) runs well ahead of the trivial capital budget, and because working capital has been broadly neutral: contract assets moved just $3 million in FY2025 and receivables $2 million, against $7.8 billion of revenue [8]. For a cost-plus and services book, that is what a healthy pattern looks like: no receivables build outrunning sales, no contract-asset balloon signalling revenue booked ahead of billing.
The adjusted-to-GAAP gap is small and legible
KBR's headline is an adjusted number, and the through-line notes that GAAP sits below it. It does — but the gap is modest and its parts are identifiable, not a euphemism for recurring costs dressed up as one-offs.
Source: Q4/Full-Year FY2025 Earnings Presentation, Adjusted EPS reconciliation [9].
The $0.72 distance from GAAP diluted EPS of $3.21 to adjusted EPS of $3.93 splits three ways: $0.28 is the discontinued-operations loss on winding down the HomeSafe military-moving contract; $0.28 is amortization of acquired intangibles; and $0.16 is spin-off, acquisition and integration cost [10]. Two of those three are real economic charges — the HomeSafe exit cost real money, and acquisition amortization is a genuine non-cash expense that recurs at roughly $57–58 million a year for the next five years as prior deals wash through [11]. Adjusted EPS is a fair operating run-rate; the amortization and exit costs are real and, in amortization's case, recurring.
The cash exceeds even the adjusted figure, not just GAAP. KBR's own conversion metric — operating cash flow against adjusted net income — was 110% in FY2025 and 101% the year before; adjusted free-cash-flow conversion was 102% and 89% [12]. Adjusted EBITDA of $968 million, up from $868 million, carries only $158 million of interest and $42 million of capex before it reaches cash [13]. The accounting is not flattering the cash; the cash is the sturdier number.
Nearly half the profit sits in joint ventures KBR does not consolidate
The earnings-quality issue here is composition. KBR runs many large contracts through unconsolidated joint ventures accounted for by the equity method, and that line has become a dominant share of profit. Equity in earnings of unconsolidated affiliates was $210 million in FY2025 — about 46% of the $458 million continuing-operations net income — up from $107 million, or 28%, a year earlier [14]. Almost all of that jump landed in one place: the Sustainable Technology Solutions segment's JV earnings rose from $75 million to $177 million, which management attributes chiefly to services on an LNG project [15] [16]. That reframes the segment's reported economics: STS operating income of $477 million includes $177 million of equity earnings carrying no revenue in the segment's $2.2 billion top line, so its margin on wholly-owned work is closer to 14% than the 22% the segment total implies [17].
Sources: FY2025 Annual Report (Form 10-K), Consolidated Statements of Cash Flows [18]; FY2024 Annual Report (Form 10-K), Consolidated Statements of Cash Flows [19].
Two features make this line worth pausing on. First, it is volatile in both directions: the same JVs that earned $210 million in FY2025 produced an $80 million loss in FY2022 [20]. The step-up from $107 million to $210 million is the single largest driver of the FY2025 profit gain, and there is no guarantee it holds at that level. Second, the earnings arrive on a book investment that is strikingly small: KBR's equity in and advances to these affiliates was just $107 million at year-end, down from $192 million, after $210 million of earnings and $247 million of distributions and capital returns flowed through in a single year [21]. These are high-return, cash-generative vehicles — but their profit is not KBR's to control, and it is not smooth.
The reassurance is that the cash does come out. Distributions of earnings received in cash were $170 million in FY2025, on top of an $82 million return of capital from the Brown & Root Industrial Services venture [22] [23]. Over FY2023–FY2025 the JVs distributed $407 million of earnings in cash against $431 million recognized — the accounting profit is very nearly all being converted to cash, just on the JVs' schedule rather than KBR's [24] [25]. The read: the JV earnings are cash-good but concentration- and durability-limited. A repeat of a down year like FY2022 would not threaten the balance sheet, but it would take a large bite out of reported profit.
A balance sheet levered on goodwill, not assets
For a reader who has been burned by bankruptcies and wants that risk near zero, the near-term default question resolves comfortably. Net debt stood at roughly $2.1 billion — total debt of $2.60 billion against $500 million of cash — or about 2.2 times adjusted EBITDA of $968 million [26] [27]. The senior credit facility caps consolidated net leverage at 4.00x and requires interest coverage of at least 3.00x; KBR was in compliance at year-end, with EBITDA covering interest roughly six times over [28]. Liquidity is ample: the $1 billion revolver, which does not mature until February 2029, was drawn only $395 million, leaving roughly $600 million undrawn on top of the cash balance [29] [30]. A $16.9 billion backlog, with $6.3 billion of priced-but-unexercised government options beyond it, sits behind that cash flow [31].
The caveat is what backs the equity. Of $1.50 billion of KBR shareholders' equity, goodwill alone is $2.68 billion and other intangibles a further $727 million [32]. Tangible book value is therefore about negative $1.9 billion: strip the acquired soft assets and the balance sheet has no net worth. For an asset-heavy business that would be alarming; for an asset-light services and technology firm it is the expected shape, because the value is the contracts and the people, not property. But it does mean the margin of safety here is a cash-flow and coverage story, not an asset-value one — there is no book of hard assets to fall back on if the earnings stream falters. The bankruptcy risk is low today because coverage and liquidity are strong, not because there is collateral underneath.
What would change this read
The cash-quality read is favorable, and two conditions would revise it. If equity-method JV earnings normalized back toward the $100–115 million range of FY2023–FY2024, reported profit would fall by roughly a fifth even with the core services and technology businesses unchanged — the FY2025 headline leans on a JV contribution that has proven it can halve or turn negative [33]. And because roughly $413 million of the $515 million of free cash flow went to buybacks and dividends in FY2025, leverage does not de-risk on its own; a large acquisition or a working-capital reversal on a fixed-price project would move net debt toward the covenant that today looks distant [34]. The lines to watch are the equity-earnings line in the cash-flow statement and the contract-asset balance — the two places where this business would show strain first.
Breaking KBR Into Two Companies
On September 24, 2025, KBR's board unanimously approved a plan to spin off Mission Technology Solutions — the government-services segment that is roughly 72% of revenue — into a separate, publicly-traded company, leaving behind a "New KBR" built around the Sustainable Technology Solutions licensing business [1]. The most recent filing targets completion on January 4, 2027 [2]. The reader who has been handed the two prior chapters as the KBR story now has to hold a different fact: within months, one KBR share becomes two, and the "government-dependent contractor" half of the business — the part that draws 57% of revenue from U.S. budgets — is the piece being separated out [3].
Two companies, drawn along the segment line
The split follows KBR's existing reporting structure almost exactly. SpinCo takes Mission Technology Solutions (MTS): scaled defense, space, and intelligence services for government customers. New KBR keeps Sustainable Technology Solutions (STS): a portfolio the company now describes as "over 85 process technologies" that it licenses across ammonia/syngas, chemicals, clean refining, and the circular economy, plus the engineering and advisory work attached to them [4]. The two are unequal in size and opposite in character.
Sources: FY2025 segment revenue and operating income, FY2025 10-K MD&A [5]; MTS backlog-and-options ($19.1B) and STS backlog ($4.2B) per the Q4 FY2025 earnings call [6].
MTS is the volume: about $5.6 billion of revenue at an 8.3% operating margin, backed by a backlog-and-options book of roughly $19.1 billion, up 15% in the year, with 82% of 2026 guidance already under contract [7]. STS is the margin: about $2.2 billion of revenue at a 21.6% reported operating margin [8]. That headline STS margin should be read with the caution established in Earnings to Cash: $177 million of STS's reported operating income is equity in earnings from unconsolidated LNG-linked joint ventures carried at no revenue in the segment, so New KBR's own-operations margin is closer to 14%. The joint venture that most flatters STS — Brown & Root Industrial Services — travels with New KBR, while the Aspire Defence and Affinity vehicles stay with SpinCo [9].
Management is also moving a few pieces across the line to sharpen each company: the Frazer-Nash consultancy and the U.K. Civil Nuclear portfolio shift from MTS into New KBR, a perimeter change the company says does not materially alter either business's growth or margin profile [10].
Why management is doing this
The stated logic is focus. CEO Stuart Bradie frames the spin as the culmination of a decade of portfolio transformation — from the old Kellogg Brown & Root energy-construction contractor into two "pure-play" companies, each with its own strategy, capital structure, and investor base [11]. New KBR is pitched as a low-capital-intensity technology licensor with high free-cash-flow conversion; SpinCo as a capital-light, long-duration government-services operator with predictable cash flow and a robust backlog [12].
Underneath the strategy language sits the arithmetic that connects this chapter to the report's central question. KBR trades at roughly $35 a share, about 8.6x enterprise value to consolidated operating income and near 9x forward earnings — a government-contractor multiple applied to the entire company, licensed-technology half included.
Market Cap ($B)
Enterprise Value ($B)
Op. Income ($M)
EV / Op. Income (x)
The separation is, at bottom, a bet that unbundling lets each piece find its own multiple: a specialty process-technology licensor and a scaled defense-services firm rarely trade at the same price of earnings, yet today the market pays one blended figure for both.
Source: market capitalization at about $35 per share (market data, July 17, 2026); operating income from the FY2025 10-K, with net debt and enterprise value derived from reported figures [13].
The sum-of-the-parts is a re-rating bet, not free value
It is tempting to treat a conglomerate discount as money lying on the floor. The arithmetic is more disciplined than that. The table below values each segment's FY2025 operating income across a range of multiples — from KBR's current 8x blend up to the low-double-digits that scaled services and specialty-technology names can command.
Source: illustrative, derived from FY2025 segment operating income [14]. Multiples are assumptions, not estimates; enterprise values before corporate costs and net debt.
Two subtractions turn gross EV into shareholder value, and both cut against the bull. First, the roughly $162 million of annual corporate cost carried above the segments does not disappear — it has to be re-created at each standalone company, and management warns those combined standalone costs will likely run higher than the current shared-service model [15]. Capitalized, that is well over $1.5 billion of value drag. Second, net debt of about $2.1 billion has to be apportioned between the two companies and netted out.
The math makes the point plain. At the current 8x blend, the combined segment EV of about $7.5 billion, less re-created corporate cost and net debt, lands near today's roughly $4.6 billion market capitalization — unbundling at the same multiple reproduces the current price, and dis-synergies make it marginally worse. The value only appears if the pieces re-rate: at 11x the same math implies equity value around $6.6 billion, and at 14x closer to $9.5 billion. The separation does not unlock a discount that already exists so much as create the conditions for one to close — and that closing depends on multiples KBR does not currently earn and on an STS operating-income figure that its own joint-venture concentration inflates.
A peer just ran this play
KBR is not theorizing. Jacobs Solutions, a direct engineering-and-government-services peer, completed a separation of its Critical Mission Solutions and Cyber & Intelligence government businesses in September 2024, receiving roughly $911 million of cash from the spun-off entity as part of the structure [16]. The relevance runs two ways. It is a live template for how a mixed engineering-and-defense company splits its government arm from its higher-multiple businesses, and it is a reminder that these transactions typically pair the spin with debt raised at SpinCo to fund a cash payment back to the parent — the same mechanism KBR flags when it warns of "the inability of the spun-off company to incur sufficient indebtedness to allow for a distribution to us of proceeds" [17]. The analysis is most sensitive to how the $2.1 billion of net debt is divided and how much cash flows back to New KBR — that split, still undisclosed, sets each standalone company's leverage and is what the illustrative sum-of-the-parts above cannot yet pin down.
What can go wrong, in the company's own words
The spin is announced, not done, and it remains subject to a private letter ruling or tax opinion from the IRS, an effective Form 10 registration, completion of financing, and final board approval — any of which can slip or fail [18]. Management states plainly that it cannot assure completion "on the anticipated timeline or at all," that separation expenses "may be significantly higher than what we currently anticipate," and that failure to qualify as tax-free could trigger significant tax liabilities for the company and its shareholders [19]. Those costs have already begun to show: the Q1 FY2027 corporate operating loss rose to $44 million, up $6 million, driven mainly by spin-related expense [20].
The most candid line sits in the risk factors: "following the proposed separation, the combined value of the common stock of the two publicly-traded companies may not be equal to or greater than what the value of our common stock would have been had the separation not occurred" [21]. Beyond value, each company becomes smaller and less diversified, loses purchasing scale, and will depend on the other under transition-services, tax-matters, and employee-matters agreements during the handover [22].
The separation is a governance and structural event, not yet a value event. It creates the mechanism for a re-rating; it does not guarantee one, and management explicitly declines to promise the two pieces will be worth more than the whole.
Timeline and what to watch
The transaction has moved from a wide "mid-to-late 2026" window at announcement to a firm target of January 4, 2027, the first business day of fiscal 2027 [23]. Goldman Sachs is financial adviser; the company employs about 37,000 people across the two future businesses [24]. Leadership is being built out in parallel: Mark Sopp was named interim SpinCo CEO to lead the transaction while the search for a permanent CEO and CFO continues [25].
Sources: announcement and timing [26]; Form 10 progress, perimeter and leadership per the Q4 FY2025 call [27]; firm target date per the Q1 FY2027 10-Q [28].
Three checkable items decide whether this event helps or hurts. The Form 10 registration will, for the first time, publish carve-out financials and the debt split — that document is where New KBR's true standalone margin (ex-joint-venture) and SpinCo's net leverage become visible, and the read is more sensitive to those figures than to any multiple assumption above, because they set the base the multiples are applied to. The IRS tax ruling either arrives or it does not; a tax-free spin and a taxable one are very different outcomes. And the standalone cost guidance management has promised will show how much of the segment margin survives the loss of shared scale. Until the Form 10 lands, the only public basis for pricing the two companies is one company's consolidated segment note.
What New KBR is worth on its own economics
After the planned spin (The MTS Spin-Off), continuing holders keep Sustainable Technology Solutions — "New KBR," a real process-technology licensor with 85-plus proprietary technologies across ammonia, chemicals, refining and circular processes [1]. Its FY2025 headline economics rest on a narrower base than the ~21.6% segment margin advertises. The profit engine investors are buying is largely one minority stake's own estimate: $210 million of FY2025 equity in earnings — about 46% of KBR's continuing net income and $177 million of it inside STS — flows from joint ventures KBR does not control, and the year's growth was driven by a $134 million one-time favorable change in estimate on a single 45%-owned LNG construction JV, a revision larger than the entire $103 million rise in equity earnings. [2] [3] [4] [5]
That concentration is a durability concern, not fictional profit: the JV earnings are cash-backed — $170 million of distributions plus an $82 million return of capital in FY2025, and $407 million distributed against $431 million recognized over FY2023–FY2025 [6]. Strip the one-time revision and STS's own operations — gross profit of $429 million less $127 million of SG&A — earned roughly $300 million, a ~13.7% margin; the durable base is that ~$300 million plus a recurring JV contribution, not the $477 million and ~21.6% the FY2025 segment total advertises [7].
The business that remains
STS is the segment that becomes the standalone company. It licenses a portfolio of "over 85 innovative, proprietary, sustainability-focused process technologies" spanning four verticals — ammonia/syngas, chemicals/petrochemicals, clean refining, and circular-economy processes — and wraps that IP in engineering, proprietary equipment, catalysts and advisory services [8]. Its record over five years is one of genuine expansion: revenue nearly doubled from $1.19 billion in FY2021 to $2.21 billion in FY2025, and segment operating income swung from a $30 million loss to $477 million [9].
Source: KBR segment disclosures, FY2021–FY2025, as reported [10].
The margin arc — negative in FY2021, 3.8% in FY2022, then a step to roughly 19–22% from FY2023 — tracks, almost exactly, the swing in profit from joint ventures KBR does not control.
What the ~22% margin contains
KBR itself now separates the layers. On its Q1 FY2026 call, management broke STS into a margin tier: proprietary technology licensing, engineering solutions and complex program development earn above 25% adjusted EBITDA margins; proprietary equipment, catalyst and domestic maintenance (accessed "primarily through recurring JV") sit below 10% [11]. The high-margin licensing core is real. It is also not most of the revenue.
The clearest evidence is management's own ex-LNG cut. STS's Q1 FY2026 adjusted EBITDA margin was 21.9%; excluding a single LNG project it was 16.1% [12]. Management was blunter still on the call: "growth in our services business has outpaced technology sales, resulting in margins of approximately 15% with the LNG project adding an incremental 500 basis points" [13]. The premium label is "technology licensor"; the mix has drifted toward lower-margin services, and a construction JV supplies the difference between mid-teens and headline.
The full-year segment note tells the same story on an operating basis. Of STS's $477 million FY2025 operating income, $177 million was equity in earnings from unconsolidated JVs carried at no revenue in the segment's $2.21 billion top line; STS's own operations — gross profit of $429 million less $127 million of SG&A — earned roughly $302 million, a ~13.7% margin rather than the ~21.6% the segment total implies [14].
Sources: reported segment operating margin, FY2025 10-K [15]; ex-LNG adjusted EBITDA margin, Q1 FY2026 deck [16]; own-operations margin derived from FY2025 segment gross profit less SG&A [17]. Bases differ (operating vs adjusted EBITDA); shown to bracket the range.
The LNG project doing the lifting
The JV flattering STS is identifiable. KBR holds a 45% interest in KZJV, a joint venture with Zachry Group performing engineering and construction services for the Plaquemines LNG facility in Louisiana, accounted for by the equity method inside STS [18]. Equity in earnings from all unconsolidated affiliates rose $103 million, or 96%, to $210 million in FY2025, "primarily attributed to equity in earnings from services on an LNG project within our STS segment" [19].
What makes that lift fragile is its source. Buried in the critical-estimates disclosure: "During fiscal 2025, we recognized a favorable change in operating income of $134 million as a result of changes in estimates on an LNG project" [20]. On a cost-to-cost construction JV, a favorable change in estimate is a cumulative catch-up — profit pulled forward when the estimated cost-at-completion improves, not a repeatable run-rate. At $134 million it is larger than the entire $103 million year-over-year rise in equity earnings. Absent that revision, STS's JV contribution — and its reported profit growth — would have been roughly flat to lower.
That is what the multi-year equity-earnings line looks like: not an annuity, but a series governed by project timing.
Source: KBR consolidated results and equity-method roll-forward, FY2022–FY2025 [21]; FY2022 loss and FY2023 figure per prior 10-Ks.
Management's answer is that the backfill is "portfolio-based rather than a one-for-one replacement": as Plaquemines rolls off, higher-margin, more-recurring streams — technology licenses and JV operating-and-maintenance work — are meant to sustain "a 20%-plus weighted STS margin profile in 2026" [22]. That is a plausible plan, not a delivered fact, and it depends on the licensing tier growing faster than the services that have lately outgrown it.
The moat, measured against a real peer
The licensing IP is not marketing. KBR holds what it calls the leading ammonia technology "for all colors," the largest single-train ammonia design in the market, a first-of-kind ammonia-cracking process, plus drop-in SAF (PureSAF), plastics-recycling (Hydro-PRT) and brine-to-battery lithium (PureLi) technologies [23]. A century of process-licensing references is a genuine, hard-to-copy advantage in the narrow licensing slice.
For a standalone valuation, what matters is how much of the whole that narrow slice is worth. The cleanest benchmark is Technip Energies, the closest listed process-technology licensor in LNG, hydrogen and ammonia. Its strategy is explicitly to grow the "shorter-cycle Technology, Products and Services" business precisely because it "enhance[s] overall margins" [24]. Even so, that segment earned a 14.3% adjusted recurring EBITDA margin (12.9% at EBIT) in FY2025 [25]. A best-in-class technology-and-services energy business runs low-to-mid-teens margins — right where STS sits once the LNG catch-up is removed (16.1% ex-project) [26].
Sources: KBR STS adjusted EBITDA margins, reported and ex-Plaquemines, Q1 FY2026 [27]; Technip Energies TPS adjusted recurring EBITDA margin, FY2025 [28].
The read: STS holds a narrow, real moat in licensed process technology, but on blended economics it is a mid-teens-margin technology-and-services business, not a 22%-margin one. The gap to the headline is a construction JV, and part of that JV's FY2025 profit was a one-time estimate revision.
The tailwinds behind it
The demand backdrop is the strongest part of the bull case, and it is quantifiable. At its 2024 investor day KBR framed 2023–2027 market growth by vector: 100–125% for new energies (plastics recycling, sustainable aviation fuel, transport electrification), and 15–20% for both clean refining/petrochemicals and LNG/energy security [29].
Source: KBR 2024 Investor Day, STS growth vectors — market-CAGR estimates are illustrative and company-sourced [30].
Those are market-growth expectations, not booked orders, and the 100–125% figure sits on a small base. The near-term evidence is more mixed: FY2025 STS revenue grew only 2% [31], and the fourth-quarter release tied softer revenue to "delays in new awards as customers reassessed capital allocation, including reduced petrochemicals capex and a pause" in green projects [32]. What supports the growth case is the order book excluding the noisy LNG line: STS book-to-bill ex-LNG was 1.2x in Q1 FY2026 (1.2x trailing twelve months), backlog reached roughly $4.7 billion (up 9% year-over-year), and the ex-LNG pipeline exceeded $5 billion [33]. A 1.2x book-to-bill underpins mid-teens revenue growth — real, but a different pace than the investor-day vectors imply, and dependent on final-investment-decision timing KBR does not control.
What it means for the standalone value
New KBR is a growing, cash-generative technology-and-services business with a genuine but minority high-margin licensing core. The adjustment a value investor most needs to make is to the earnings base: the durable figure is closer to the ~$300 million of own-operations operating income (mid-teens margin) plus a normalized, recurring JV contribution than to the $477 million and ~21.6% the FY2025 segment total advertises [34]. Any multiple placed on the reported figure inherits a $134 million one-time estimate change and a construction JV that is rolling off [35].
The strongest fact against that caution is management's portfolio-backfill plan paired with a 1.2x ex-LNG book-to-bill: if higher-margin technology licenses and recurring JV work grow into the space Plaquemines vacates, the 20%-plus margin could prove more durable than a "one LNG project" framing suggests [36]. What would settle it is checkable and near: the Form 10 audited carve-out financials (expected public around September 2026) will show standalone STS margins with the JV disaggregated; the pace of the LNG roll-off against new JV and licensing bookings; and whether ex-LNG book-to-bill holds above 1.0x. Until those land, the honest base case values New KBR on mid-teens underlying economics, not the headline.
Backlog Durability
Mission Technology Solutions is the larger company after the spin and the source of 57% of KBR's revenue, so the durability of its government order book weighs heavily on the case. Government revenue does not only leave through recompete losses — a customer can terminate a won, exclusive contract outright, as TRANSCOM did to HomeSafe, or in-source it, as NASA has signalled — which is why the government half is a narrow moat rather than a fortress. [1][2][3][4]
The exposure the termination illustrates is concrete. HomeSafe — a 72%-owned joint venture that held the exclusive award for U.S. armed-forces household-goods moves — was terminated by U.S. Transportation Command in June 2025 and, by the start of fiscal 2026, had ceased all operations and been carried entirely as discontinued operations [5]. It is not the only won work in limbo: $3.0 billion of awards KBR had already won sat frozen in protest at the third quarter of fiscal 2025, up 50% in a single quarter [6], and the Readiness and Sustainment line fell about 15% over two years, from $1,495 million in fiscal 2023 to $1,277 million in fiscal 2025 [7]. That recompete-and-termination discount is what argues for pricing MTS at the low end of the government-services multiple range in The Government Half rather than a premium.
The counter-fact sits in the same frame: these are concentrated, identifiable events, not broad franchise erosion. Management describes the bulk of the MTS U.S. portfolio as mission-essential work on well-funded multiyear programs, and 91% of fiscal 2026 revenue was already under contract entering the year [8]. The pricing of the government half is worked out separately in The Government Half; this chapter asks the prior question — whether that revenue holds together when contracts come up for renewal.
What the order book is made of
KBR's total backlog was $16.9 billion at the start of fiscal 2026, of which about 17% sits inside equity-method joint ventures, and the company expects to convert roughly 36% of it into revenue within fiscal 2026 [9]. A book that turns over roughly a third each year implies an average life close to three years for the work that recognizes as revenue — short enough that renewal risk is a live, recurring event, not a distant one.
The order book splits into two very different kinds of contract. Private finance initiatives (PFIs) — the Aspire Defence and U.K. Military Flying Training System programs — are long-term, predominantly fixed-price U.K. contracts with terms of 15 to 35 years covering the construction and lifecycle management of government assets [10]. These do not recompete during their term; they are the annuity. The rest — cost-reimbursable and time-and-materials work performed mostly for U.S. defense, intelligence and civilian agencies — is the part that periodically goes back out to bid.
Source: contract-type mix from the FY2025 10-K [11] and FY2024 10-K [12]; June 2022 (then-Government Solutions segment) from the Q2 2022 earnings release [13].
At the start of fiscal 2026, 39% of backlog was PFIs, 24% cost-reimbursable, 20% time-and-materials and 17% fixed-price [14]. The PFI share has been stable near 36–39% for three years. Because every one of KBR's PFIs sits inside MTS, and because the fixed-price bucket is largely STS engineering work, the annuity share within the government segment is higher than the 39% headline — comfortably over half of MTS's own backlog. The remaining cost-reimbursable and time-and-materials work — the recompete-exposed core — is roughly 44% of the consolidated book.
Two qualifiers keep this from being over-read. First, the reported "backlog" excludes $6.3 billion of priced option periods the customer has not yet exercised, and only 40% of MTS backlog is actually funded once PFIs are stripped out [15]. The growth the company advertises in its $19 billion "backlog and options" figure is unexercised optionality, not committed work: over fiscal 2025 MTS's backlog and options rose to $19.1 billion from $16.6 billion while its committed backlog held roughly flat at $12.7 billion [16]. Second, the company's headline book-to-bill deliberately excludes the U.K. PFIs, the Plaquemines LNG project and the HomeSafe joint venture [17] — so the ~1.0x order intake investors watch is the recompeteable core, and MTS's fell to 0.5x in the fourth quarter of fiscal 2025 [18].
Diversification is the first line of defense
Within the government segment, no single program dominates. KBR's largest customer disclosure names the U.S. Army, Navy, Air Force, Space Force, Missile Defense Agency, the National Geospatial-Intelligence Agency, the National Reconnaissance Office, NASA and the U.K. government — and states that beyond the U.S. government (57%) and U.K. government (9%) in aggregate, no other customer represented 10% or more of consolidated revenue in any period shown [19]. A recompete loss on any one vehicle is survivable; the concentration is at the level of the customer (the U.S. government), not the contract.
The internal mix has also been shifting toward the more durable work. Defense and Intel revenue rose from $2.50 billion in fiscal 2023 to $3.18 billion in fiscal 2025, while the Readiness and Sustainment line — the contingency, logistics and base-support work most exposed to troop levels and the European drawdown — fell from $1.50 billion to $1.28 billion; Science and Space held flat near $1.1 billion [20].
Source: KBR segment revenue disclosures, FY2023–FY2025 10-K [21]. Fiscal 2025 is the year ended Jan 2, 2026.
PFI Share of Backlog
Recompete-Exposed Backlog
FY2026 Revenue Under Contract
Won Work Under Protest ($B)
Sources: contract-type backlog mix from the FY2025 10-K [22]; work under contract now covers approximately 91% of 2026 revenue guidance, per the Q1 FY2026 call [23]; protest figure from the Q3 FY2025 call [24].
The recompete mechanism, and what it costs
KBR states the risk in its own words: "Many of our existing contracts must be recompeted when their original period of performance ends, representing opportunities for competitors to take market share away from us." The same passage warns that even a won award "may be subject to a lengthy protest process" that can "delay the recognition of sales and defer underlying cash flows" [25]. This is not boilerplate for KBR; it is what fiscal 2025 actually looked like.
By the third quarter of fiscal 2025, KBR disclosed $3.0 billion of contracts it had won still frozen in protest — up 50% in a single quarter, with the largest addition a classified program in the Indo-Pacific command — and management said conversion "remains uncertain" in the government-shutdown environment [26]. Winning the bid is not the same as booking the revenue; protests sit between the two, and the gap was widening.
The sharper illustration is HomeSafe. KBR's 72%-owned joint venture had been selected as the exclusive provider of household-goods moves for the U.S. armed forces — precisely the kind of long-duration, sole-award win that is supposed to anchor a backlog. In June 2025, U.S. Transportation Command "unexpectedly terminated" that role; by the start of fiscal 2026 all of HomeSafe's operations had ceased and the business was carried as discontinued operations [27]. KBR's own risk factors now cite HomeSafe as the working example that "following contract award, we may also encounter significant expense, delay, contract modifications or even contract loss or termination" [28]. A won, exclusive, multi-year government contract went to zero inside a year.
A quieter version of the same risk runs through NASA, where KBR has worked for more than 60 years. Management flagged in early 2026 that the agency's administrator had signaled interest in in-sourcing certain core workforce competencies, an outcome already reflected in the 2026 outlook as a change in the mix of work [29]. Recompete is not the only way government revenue leaves; the customer can also decide to do the work itself.
The incumbency that holds it together
Against those losses sits real evidence of stickiness. The clearest is that KBR keeps winning its recompetes: its single largest recompete of fiscal 2025 was the NASA astronaut health-and-human-performance contract, re-awarded to KBR at a $2.5 billion ceiling plus $1 billion of options — though management was candid that the booking value was below $1 billion, "more consistent with the current run rate" [30]. That single award captures the whole tension: KBR retains the mission, but the government sets the price, and the run-rate can reset lower even on a win.
The incumbent's advantages are genuine but ordinary for the industry: cleared personnel, decades of past performance, and cost-reimbursable structures under which the customer bears most of the execution risk and rarely switches a functioning provider mid-mission. Management describes the bulk of the MTS U.S. portfolio as "mission essential operational work" on "well-funded multiyear programs," which is why 91% of fiscal 2026 revenue was already under contract entering the year and why recent quarters added a LOGCAP extension and a Department of Transportation recompete that "extended a long-standing partnership" [31].
The advantage is not a wall, and KBR's own disclosures show why. It performs mostly under cost-reimbursable contracts — the same low-risk, recompete-exposed model a pure government-services peer such as Booz Allen Hamilton runs, where 59% of revenue is cost-reimbursable [32]. And KBR is perfectly capable of taking share the same way: it recently won a seven-year, $176 million space-surveillance program by displacing the incumbent [33]. Incumbency slows competition; it does not stop it, in either direction.
Weighing the moat
MTS is a narrow moat rather than a fortress. The durable core is real and quantifiable: an annuity of 15-to-35-year U.K. PFIs that is more than half of the segment's backlog, a customer base diversified across every major defense and civil agency with no single program above 10% of revenue, high past-performance win rates on recompetes, and 91% revenue visibility a year out. The offsetting evidence is equally concrete: most U.S. work must be re-won every few years, $3 billion of awards can sit stranded in protest, a customer can in-source or — as HomeSafe showed — simply terminate, and even retained work can reprice lower.
On balance the segment should be valued as a stable-but-slow government-services franchise carrying a genuine recompete discount, which is consistent with the low end of the peer multiple range applied in The Government Half rather than a premium. What would move the read toward the durable end: firm backlog — not options — resuming growth, the recompete-core book-to-bill holding above 1.0x for several quarters, the $3 billion of protested awards converting to revenue, and the NASA in-sourcing staying contained to mix. What would move it the other way: a second HomeSafe-style termination, a lost anchor recompete, or the funded share of backlog continuing to erode. The Form 10 that splits the company will be the first place to see MTS's standalone backlog laid out on its own — and the first clean test of how much of this order book the market should pay for.
The Government Half
The larger of KBR's two businesses — Mission Technology Solutions, the piece being spun off — is the half the thesis flags for government-budget risk. It is roughly $5.6 billion of revenue at an 8.3% operating margin, with 57% of consolidated sales tied to the U.S. government. Its revenue is now shrinking on procurement delays even as margins hold, and a defensible government-services multiple for it accounts for most of KBR's entire enterprise value — leaving little for the technology half at today's price.
MTS Revenue FY2025 ($M)
Operating Margin
Adj. EBITDA Margin
U.S. Gov Revenue
Source: FY2025 10-K, segment results and major-customer disclosure [1]; [2]; adjusted EBITDA per Q4 FY2025 earnings release [3].
MTS is what most people still picture when they hear "KBR": logistics, base operations, engineering and mission support for the U.S. Army, Navy, Air Force, Space Force, the intelligence agencies, NASA, and the U.K. Ministry of Defence [4]. U.S. government contracts supplied $4,427 million, or 57% of consolidated revenue, in FY2025, with another $663 million (9%) from the U.K. government — roughly two-thirds of the whole company sold to two treasuries, nearly all of it inside this one segment [5]. This is the exposure that leaves when the spin completes, and it is worth valuing on its own terms rather than as a fraction of a blended KBR.
Flat revenue, rising margin, softening orders
MTS revenue was essentially unchanged in FY2025 — up $26 million, to $5,581 million — despite carrying a full year of the LinQuest acquisition (closed August 2024). Strip the acquisition out and the underlying book contracted: the segment absorbed reduced activity in European Command work and in science and space programs [6]. Operating income nonetheless rose to $463 million, an 8.3% margin, from $415 million (7.5%) a year earlier — helped by a $26 million legacy claim resolution and by cost savings from the January 2025 segment realignment [7].
Source: FY2025 10-K, Results of Operations by Business Segment [8].
The exit rate is weaker than the full-year figure. Fourth-quarter FY2025 MTS revenue fell 14% year on year to $1,295 million, which management attributed to EUCOM scope reductions, procurement delays across defense and intelligence clients, funding restrictions at federal civilian agencies, and delays in new awards "including awards won under protest"; book-to-bill that quarter was just 0.5x [9]. The most recent quarter (ended April 3, 2026) showed the decline moderating but persisting: MTS revenue down 6% to $1,296 million, adjusted EBITDA margin holding at 10.6%, and book-to-bill recovering to 1.1x [10]. The pattern is a business whose margin is resilient but whose top line is contracting as government awards slow.
Book-to-bill fell to 0.5x in Q4 FY2025 before recovering to 1.1x in Q1 FY2026. A sustained reading below 1.0x means bookings are not replacing revenue burn — a checkable early signal on whether the MTS revenue decline stabilizes or deepens.
Order-book quality carries the same caveat. MTS reported $19.1 billion of "backlog and options" at FY2025 year-end, up 15%, but firm backlog was only $12.7 billion and barely grew — the entire increase in the headline number came from options, the uncommitted portion a customer may never exercise [11].
Source: derived from FY2025 Q4 earnings release — backlog and options less firm backlog [12].
The budget backdrop cuts both ways
The near-term signal is genuinely soft. The federal government entered a shutdown on October 1, 2025, and KBR reported delays in both payment collection and contract awards; the administration's efficiency drive produced federal staff reductions and hiring freezes that management expects to delay awards further [13]. One nuance the earlier record understates: the Department of Government Efficiency was created by executive order in January 2025 and disbanded in November 2025 — the acronym that dominated the 2025 narrative is already gone, though KBR notes it "cannot rule out" similar initiatives, and broader procurement reform (Executive Order 14275 and a November 2025 defense-acquisition overhaul) continues [14].
Against that, the medium-term funding picture firmed. The reconciliation bill signed July 4, 2025 provides more than $150 billion in mandatory Department of Defense funding available through September 2029; NATO members agreed in June 2025 to spend 5% of GDP on defense by 2035; and the U.K. and Australia — where KBR's international government work sits — are both raising defense budgets [15]. MTS faces a timing problem, not a demand collapse: appropriations and awards are being delayed by process disruption, while the underlying defense budget is rising. That distinction is what separates a stock that has fallen too far from one that has fallen for cause, and the evidence so far supports the former for this segment.
Pricing the government half
MTS has no separately reported net income — a segment carries no interest or tax allocation — so it is valued on enterprise-level multiples against the government-services peers KBR itself names. Those peers trade in a wide band: Leidos and Booz Allen at roughly 9x trailing earnings, SAIC nearer 13.5x, on operating margins from 7% to 12%.
Sources: peer revenue and operating income per latest reported financials; market capitalisations and P/E as reported; EV/EBIT derived for Booz Allen and SAIC from reported net debt (Leidos debt not in the feed). MTS segment figures per FY2025 10-K [16].
MTS's 8.3% operating margin sits mid-pack — above SAIC, below Leidos — but its shrinking revenue argues for the lower end of the peer range rather than the middle. Applying 8x to 12x to MTS's $463 million of FY2025 operating income implies an enterprise value of roughly $3.7 billion to $5.6 billion, with a central estimate near $4.6 billion at 10x. This is illustrative, not a target: it rests on FY2025 operating income that included the $26 million one-off, and it does not yet reflect the standalone corporate costs the segment will carry once separated.
Source: derived — MTS operating income $463M at 8x/10x/12x EBIT, residual against KBR's ~$6.6B enterprise value; segment income per FY2025 10-K [17].
The reconciliation is where it matters. KBR's whole enterprise is worth about $6.6 billion today (roughly $4.5 billion of equity plus $2.1 billion of net debt), and what that leaves for Sustainable Technology Solutions swings with the multiple applied to MTS. At a mid-range 10x, MTS is worth about $4.6 billion and the residual for STS is roughly $2.0 billion — about 6.6x that segment's own-operations operating income of about $300 million (New KBR Economics). At the low-end 8x that MTS's shrinking revenue arguably warrants, MTS is worth about $3.7 billion and the residual STS multiple rises toward 9.7x. Across that ≈6.6x-to-9.7x range STS still prices below the mid-teens multiple a licensing peer such as Technip Energies commands — the sum-of-the-parts case seen from the government side: the market is paying a defense-services multiple for the whole company and picking up the technology licensor at a discount. What warrants the low-end MTS multiple is not only the revenue decline but the way won government work can disappear (Backlog Durability). Government revenue does not only leave through recompete losses — a customer can terminate a won, exclusive contract outright, as TRANSCOM did to HomeSafe, or in-source it, as NASA has signalled — which is why the government half is a narrow moat rather than a fortress. The read cuts the other way too: STS's own reported profit is flattered by a concentrated LNG joint venture (New KBR Economics), so its own-operations base is itself uncertain. The mispricing is real only if MTS holds a respectable multiple despite shrinking.
Where the debt lands
The separation also decides who carries KBR's borrowings, and that bears directly on the near-zero-equity concern a balance-sheet-minded reader would raise: net debt is about $2.1 billion, or 2.2x adjusted EBITDA, against a company whose tangible book value is negative (Earnings to Cash) [18]. The relevant precedent is Jacobs' 2024 government-services separation, where the spun-off entity raised debt and paid roughly $911 million of cash to the parent before departing [19]. KBR's own spin roadmap lists a discrete "Debt Financing" step for the departing entity ahead of the distribution [20].
The mechanics KBR has disclosed point one way, without confirming it: on the Jacobs template, the spun-off MTS would raise the debt and distribute cash to the parent, leaving New KBR (the technology business) largely deleveraged while MTS goes public carrying leverage into a soft-demand window. That would ease the negative-tangible-book concern for continuing holders but load the risk onto the government-services security. The precise split is not yet in the record — the Form 10 registration statement, which will show each successor's day-1 balance sheet, was still pending as of the latest filings [21]. Until it lands, the debt allocation is the largest unresolved variable in valuing either half, and the Form 10's leverage disclosure for MTS and New KBR is the item to read first.
Watch item: the Form 10 registration statement for the MTS spin-off. Its two disclosures that move the analysis most are (1) how the roughly $2.1 billion of net debt splits between MTS and New KBR, and (2) MTS's standalone corporate-cost run-rate — which will convert the illustrative ~$4.6 billion enterprise value here into a real equity value.
Management and Ownership
KBR has no controlling owner and thin insider holdings — directors and executive officers together own 1.15% of the stock, and the register is dominated by index funds [1]. For a reader who prizes founder skin-in-the-game, that is a genuine gap. The offsetting evidence is in the alignment mechanics: pay is 89% at-risk, the CEO's realized pay fell by more than half as the stock de-rated, and directors and the new CFO bought shares on the open market below today's price.
An institutional register, not a founder's company
KBR is professionally managed. Founded as Kellogg Brown and Root and spun out of Halliburton at its 2006 IPO, it has no anchor shareholder; the three largest holders are passive managers — FMR (Fidelity) at 15.0%, Vanguard at 9.85%, and BlackRock at 9.28% — together roughly a third of the company [2]. All eleven directors are independent except the CEO, who in 2025 also took the Chair role; the board created a Lead Independent Director (Lt. Gen. Wendy Masiello, retired) to preserve independent oversight of a now-combined Chair and CEO [3].
Insiders (dir. + officers), % of shares
Top 3 index holders, % of shares
CEO stake value ($M)
Source: 2026 Proxy Statement, Security Ownership table (holdings as of March 2, 2026; CEO stake = 750,093 shares at $35.14) [4].
The 1.15% aggregate is the headline skin-in-the-game number, and it is small. But the distribution matters. CEO Stuart Bradie, in the role since 2014, holds 750,093 shares — about $26 million at the current price, roughly 20 times his base salary and well above the board's 5x-salary ownership requirement, which every covered officer has met [5]. Alignment at the top is real in dollar terms; what is absent is a large-block owner whose personal wealth swings with the share price the way a founder's would.
Pay is heavily at-risk, and the de-rating has been felt
The compensation structure is conventional for a large-cap contractor and sits at the aligned end of it. Only 11% of the CEO's target pay is fixed base salary; the remaining 89% is performance-based, and 72% is long-term equity and performance awards [6]. Bradie's reported 2025 total compensation was $11.6 million, a 134:1 ratio to the median employee [7].
The test of that structure is whether realized pay actually moves with the stock. It does. The proxy's Pay-Versus-Performance table shows "compensation actually paid" — grant values marked to the year-end share price — collapsing from $13.4 million in 2024 to $4.9 million in 2025, a 64% drop, as the company's indexed total shareholder return fell from 199 to 138 [8]. The 2025 realized figure is 58% below the $11.6 million grant-date number. The de-rating that halved the stock also cut the CEO's realized pay by more than half in a single year.
Source: 2026 Proxy Statement, Pay Versus Performance table [9].
The same table carries the counter-fact. Over five years KBR's indexed shareholder return reached 138 against its own compensation peer group's 213 — the stock lagged the peers management is benchmarked against, and by a widening margin in 2025 [10]. The pay design is aligned; the performance it was aligned to has trailed. Shareholders have not objected: the 2025 say-on-pay vote passed with roughly 99% support [11].
Source: 2026 Proxy Statement, Pay Versus Performance table; TSR indexed to $100 invested at end-2020 [12].
Capital allocation: coherent priorities, one deal, a record buyback year
Management's stated deployment priorities are to fund organic growth, maintain responsible leverage and an attractive dividend, make accretive acquisitions, and repurchase shares [13]. The record over the past five years is consistent with that framing, and the two largest recent actions — the LinQuest deal and the FY2025 buyback — bear examination.
LinQuest, closed August 2024, was KBR's principal recent acquisition: $739 million of consideration ($738 million net of cash) for a space, air-dominance and digital-integration business that moves the government segment up-market [14]. It was debt-funded, drawing a $550 million term loan and $50 million on the revolver, and it was overwhelmingly intangible: of the $749 million fair value allocated, $526 million became goodwill and $200 million other intangibles, leaving only about $23 million of tangible net worth [15]. That is the norm for a services acquisition, but it compounds the negative-tangible-book profile the balance sheet already carries.
The deleveraging that followed was quick. Net debt to EBITDA rose to 2.6x when LinQuest closed and was back below the 2.5x target within three quarters, reaching 2.2x by year-end [16]. Alongside it, capital returned to shareholders reached a record [17]: $329 million of buybacks and $84 million of dividends in FY2025, against $515 million of free cash flow — an 80% payout. The dividend has been raised every year, from $0.54 per share to $0.66, and the board expanded the repurchase authorization to $750 million in February 2025 [11].
Source: derived from reported cash-flow statements, FY2021–FY2025; the record FY2025 level is noted in the FY2025 results presentation [18].
The record-buyback year invites a discipline question, because most of it was spent while the stock was falling. KBR repurchased $329 million of stock across FY2025 as the shares dropped from roughly $58 at the start of the year toward $35 by year-end; the only average price disclosed, for the Q4 tranche, was about $42.70 — above today's $35.14. The buyback was steady and large, but the year's average purchase price sat above the current quote, so the repurchases have not yet created visible per-share value. Whether that reads as conviction or as buying too early will be settled by the pace and price of repurchases from here.
Insider open-market buying below the price
The most direct alignment signal is what insiders did with their own money during the de-rating. In the recent Form 4 record they were net buyers: four open-market purchases totaling about $945,000 and no discretionary open-market sales, all in May 2026 at prices between $30.60 and $32.47 — below the current price.
Source: SEC Form 4 filings, February–May 2026, as reported.
Four buyers is a small cluster, and the newly appointed CFO taking an initial position is partly expected. But the pattern — a director who chairs the audit committee putting in nearly half a million dollars, two other directors and the CFO adding, none under pre-set 10b5-1 plans, all near the low — is the kind of signal that is easy to give and rarely given lightly.
The read
On the question the through-line raises — a company that "answers to no controlling owner" — the evidence is two-sided and worth holding in tension rather than resolving by rhetoric. The negatives are real: aggregate insider ownership of 1.15% is thin, there is no anchor shareholder, the combined Chair-and-CEO structure concentrates authority, and the company's shareholder return has trailed its own pay-benchmark peers over five years. The offsets are also real and specific: pay is 89% at-risk and demonstrably moved with the stock, the CEO holds roughly $26 million of shares, capital allocation has followed its stated priorities and net leverage was back below target within three quarters of the LinQuest deal, and insiders bought — not sold — into the decline.
The measured read is that KBR is well-governed and reasonably aligned for a professionally managed contractor, without the concentrated-ownership backstop a skin-in-the-game investor would prefer. The strongest fact against a benign view is the five-year performance gap to peers; the fact against a bearish one is the May 2026 insider buying below the current price. What would move the read is observable and near-term: continued open-market insider buying and repurchases executed below $35 would harden the alignment case, while the pending separation's Form 10 — by disclosing how leverage and the two management teams are split — will show whether both successor companies are set up to be owned as cleanly as KBR is run.
Valuation and Estimates
At $35.14, KBR trades at 8.9x its adjusted earnings and roughly 11.5% of its market value in annual free cash flow — a low-double-digit multiple that has compressed by about a third since late 2024 while earnings rose. The decline is almost entirely re-rating, not a downgrade to profit. What a value buyer weighs is that 8.9x multiple against a slow-growing contractor whose recent profit was flattered by one joint venture — cheap against the reported base, less so once that base is normalized.
Share Price (Jul 17, 2026)
Forward P/E
Free Cash Flow Yield
Upside to Mean Target
Sources: price and consensus per market data as of July 17, 2026; free cash flow of $515M against a market capitalisation near $4.5B, from the FY2025 cash-flow statement [1].
The decline was a re-rating, not an earnings miss
KBR peaked at $72.02 on November 11, 2024, closed that year near $58, and now trades at $35.14 — down about 39% from the year-end level and 51% from the peak. Over the same window the business earned more, not less: adjusted EPS rose from $3.33 in FY2024 to $3.93 in FY2025 [2], and management guides $3.87 to $4.22 for FY2026 [3]. Held against a stable ~$3.9 earnings base, the multiple fell from roughly 15x at the end of 2024 to 8.9x today. The price move is the multiple moving, not the numerator.
Source: market price history, quarter-end closes; November 11, 2024 intraday-basis peak of $72.02 shown in text. As reported.
The de-rating did not reverse when the company announced its plan to spin off the government-services segment on September 24, 2025 (The MTS Spin-Off): the stock sat near $49 that day and drifted to $35 over the following ten months. Whatever value the separation is meant to surface, the market has not yet paid for it.
Share Price since end-2024
Adjusted EPS, FY2024 to FY2025
P/E on ~$3.9 EPS, end-2024
P/E on ~$3.9 EPS, now
Sources: price change from quarter-end closes (market data); adjusted EPS $3.33 (FY2024) to $3.93 (FY2025) [4]. Multiples computed on the $3.93 FY2025 adjusted base at the two prices.
Three years of results, in one place
The record beneath the multiple is one of steady top-line growth, expanding adjusted profitability and cash that has run ahead of earnings. Revenue grew from $6.96 billion in FY2023 to $7.79 billion in FY2025; operating income rose from $449 million to $778 million; and adjusted EPS climbed from $2.91 to $3.93 [5][6]. The GAAP loss in FY2023 was a below-the-line convertible-notes charge, not an operating event (Company and Thesis); on cash the years are consistently positive, with free cash flow of $515 million in FY2025 covering adjusted net income (Earnings to Cash).
Sources: revenue, operating results and GAAP EPS from the FY2025 10-K [7]; adjusted EPS and adjusted EBITDA from earnings presentations [8][9]; free cash flow from the cash-flow statement [10]; FY2026 figures are guidance midpoints [11]. FY2026E free cash flow shown on an adjusted operating-cash-flow basis less modest capex.
What the forward numbers say
The forward setup is the counterweight to the cheap multiple: growth is decelerating to low single digits. Management's FY2026 guidance is revenue of $7.90–8.36 billion, adjusted EBITDA of $980–1,040 million and adjusted EPS of $3.87–4.22 — a midpoint about 3% above FY2025 — and it was reaffirmed at the Q1 FY2026 call in May 2026 [12][13]. Consensus sits inside that band at $3.96 for FY2026 and $4.13 for FY2027, with revenue of roughly $8.0 billion and $8.4 billion — implying adjusted EPS growth of about 1% and 4%.
Sources: adjusted EPS actuals from earnings presentations [14][15]; FY2026–27 figures are consensus estimates (market data). Management's FY2026 adjusted-EPS guidance band is $3.87–4.22.
Two features of the consensus matter for a value read. First, it barely moves: the FY2026 number has drifted down only fractionally over the past 90 days, and the balance of estimate revisions has been roughly even. Second, the analysts covering the stock are neutral-to-constructive rather than bearish — four buys, four holds and no sells — with the debate about the multiple, not the earnings. Neither the company nor the Street is forecasting a profit decline; the pessimism in the share price is about the durability and quality of the base, which the joint-venture concentration in FY2025 gives reason to question (New KBR Economics).
The multiple against its own cash and against peers
On every earnings-based measure KBR sits in the high-single-digit to low-double-digit range. Against roughly $4.5 billion of equity value and $2.1 billion of net debt — total debt of $2.60 billion against $0.50 billion of cash, an enterprise value near $6.6 billion [16] — the business trades at about 8.4x operating income and 6.8x adjusted EBITDA, falling toward 6.5x on the FY2026 guide.
Source: derived from reported FY2025 financials and market data. Enterprise value from net debt of $2.1B [17]; free cash flow of $515M [18]; shareholder returns of $329M buybacks plus $84M dividends [19].
A blended multiple obscures that KBR is two businesses with different peer sets. The government-services segment — the larger, and the piece departing in the spin — competes with a group that itself trades cheaply: Leidos and Booz Allen are near 9x trailing GAAP earnings and SAIC around 13x. The Sustainable Technology Solutions licensor's cleanest listed comparable, Technip Energies, trades closer to 16x. KBR's blended 8.9x adjusted multiple sits at or below where its government half is valued and well below its technology half — the arithmetic the separation is designed to exploit (The MTS Spin-Off).
Source: derived from each company's latest annual filing and market capitalisation (market data). GAAP trailing earnings; Jacobs and Amentum are omitted because their reported earnings are distorted by separation and merger accounting. Technip Energies reports in euros; the ratio is currency-neutral.
What the price implies
At $35.14 the market values KBR at roughly 8.9x forward earnings and 6.5x forward EBITDA — a level normally reserved for a business expected to shrink, whereas KBR and its analysts both forecast modest growth. The consensus mean price target is $46.57, about 33% above the current price, with a median of $45 and a range of $36 to $60; the mean target implies a multiple of roughly 11.8x the FY2026 estimate — a partial re-rating toward the government-services peer group, not a heroic one.
Source: consensus analyst price targets, market data as of July 17, 2026; even the lowest target of $36 sits above the current $35.14.
The read the evidence supports: KBR is priced conservatively — near the bottom of its own peer group and at a large discount to the analysts who follow it, while generating a double-digit free-cash-flow yield and returning about 9% of its market value each year in buybacks and dividends [20]. The company has $427 million left on its repurchase authorisation and has raised the dividend each year, from $0.54 in FY2023 to $0.66 in FY2025 [21][22].
The strongest fact against that read concerns the earnings base itself. The profit engine investors are buying is largely one minority stake's own estimate: $210 million of FY2025 equity in earnings — about 46% of KBR's continuing net income and $177 million of it inside STS — flows from joint ventures KBR does not control, and the year's growth was driven by a $134 million one-time favorable change in estimate on a single 45%-owned LNG construction JV, a revision larger than the entire $103 million rise in equity earnings. [23][24][25] That is the base the 8.9x multiple is measured on: strip the one-time LNG catch-up and forward earnings power is lower, so the multiple is correspondingly less cheap (New KBR Economics). The repurchases also carry a timing cost — the FY2025 buybacks were executed at prices above today's $35, with the fourth-quarter tranche bought at an average of $42.70 [26], so the buyback has not yet compounded value at the de-rated price.
What would change the read in either direction is concrete and near-term. The FY2026 quarters will show whether the technology segment holds a mid-teens margin once the LNG contribution normalises; the spin-off Form 10, expected later in 2026, will disclose each successor's standalone earnings and debt; and a re-rating of the two pieces toward their separate peer multiples — rather than the blended 8.9x — is what turns a cheap-looking contractor into realised value. Absent those, 8.9x is defensible as a fair price for a low-growth, JV-flattered, net-debt-carrying business, not obviously a mispricing.
What to Watch
This chapter reconciles the report into three scenarios and a checkable watch list. At roughly $35, KBR trades near the low end of analysts' $36–$60 target range, below a mid-teens government-services and licensing peer group. What separates the outcomes is not the earnings base — FY2026 guidance is reaffirmed — but the January 2027 spin: whether two pure-play companies re-rate, whether the technology half's margin survives a winding-down joint venture, and how ~$2.1B of net debt splits between the successors.
The setup at today's price
Share Price ($)
Forward P/E (FY2026 mid)
Mean Analyst Target ($)
FCF Yield
Sources: share price as reported (Jul 17, 2026); FY2026 adjusted-EPS guidance midpoint $4.05 from the Q1 FY2026 release [1]; forward multiple, FCF yield and target derived from consensus estimates (Valuation and Estimates).
KBR guides FY2026 to $7.90–8.36B of revenue, $980–1,040M of adjusted EBITDA, and $3.87–4.22 of adjusted EPS, reaffirmed in May 2026 [2]. The earnings base is stable; the ~$46.57 mean target sits a third above spot and even the low target of $36 is above the price. That gap is what the scenarios below take apart.
Three ways this resolves
The three cases share one number — the ~$4 of adjusted EPS the business is expected to earn — and differ on the multiple the market pays for it after the spin. The report anchors the ranges to the analysts' own $36–$60 spread rather than inventing wider bounds.
Source: report reconciliation, anchored to the consensus target range of $36–$60 (Valuation and Estimates); driver mechanics cited in the rows below.
Source: report reconciliation; peer multiples and the sum-of-the-parts arithmetic developed in The MTS Spin-Off, New KBR Economics and The Government Half.
The base case is close to where consensus already sits: a partial closing of the discount as the spin removes conglomerate ambiguity. The bull case needs both halves to earn their peer multiples at once — the licensing business to be valued as licensing, and the government business to hold a normal services multiple despite a shrinking top line. The bear case needs neither disaster nor fraud, only for the two doubts the report has documented — a joint-venture-flattered technology margin and a contracting government book — to persist while the multiple stays where it is.
Where bulls and bears disagree
Each row below is a shared fact from the filings, not a mood. The disagreement is about what the same number implies, and the final column names the evidence that would settle it.
Sources: spin terms [3]; segment margins [4]; joint-venture equity earnings [5]; MTS backlog and book-to-bill [6]; balance sheet [7].
Two rows carry most of the weight. The technology margin is the report's central caveat: STS reports a ~22% operating margin, but a large share is equity in earnings of unconsolidated affiliates — $210M in FY2025, up 96% from $107M [8], concentrated in the Plaquemines LNG venture. Strip that and STS's own operations run in the mid-teens, in line with the best licensing-plus-services peers rather than ahead of them (New KBR Economics). The government half is the mirror image: a firm backlog of $12.6B that barely moved while revenue fell, with the order-book growth sitting in options rather than committed work [9].
The watch list
The items below are dated and falsifiable: each names a filing, a line item, and a threshold that would move the read. They are ordered by how much they narrow the range above.
Sources: spin conditions and timeline [10]; FY2026 guidance [11]; segment metrics [12].
The read is most sensitive to the Form 10 debt split: it resolves the debt-split question that the report has flagged repeatedly and converts the illustrative sum-of-the-parts into two real balance sheets — each successor's day-one leverage, standalone corporate cost, and equity value. The spin remains conditional on that filing's effectiveness, the IRS ruling, financing, and a final board vote [13], so the January 2027 date is a target, not a certainty.
What would change the read
The evidence is genuinely two-sided, and the report does not force a winner. On the value side: a stable ~$4 earnings base, a ~11.5% FCF yield, a net-leverage ratio of 2.3x against a covenant that only tightens after a large acquisition [14], directors buying in the open market, and a catalyst with a date. On the caution side: a technology margin flattered by one concentrated joint venture, a government segment shrinking at the top line, negative tangible book, no controlling owner, and a re-rating that depends on the pieces earning multiples they do not yet command.
Three developments would settle it. A Form 10 that leaves New KBR lightly levered, an STS ex-LNG margin that holds in the mid-teens as the LNG venture rolls off, and MTS book-to-bill sustaining above 1.0x would together support the base-to-bull path. The reverse — a debt-heavy technology successor, a margin step-down as joint-venture earnings normalize, and orders slipping again — would validate the discount the market is currently applying. Both are visible in filings that arrive over the next four quarters.